Bitcoin Cash price rises 16% in one week, and estimates 38.51% northward movement
- Bitcoin Cash price recovers above a falling wedge pattern.
- The IOMAP chain model points to diminishing resistance along BCH’s mining path.
- A daily candlestick above the 100-day EMA will validate the Bitcoin Cash uptrend; otherwise, expect a trend reversal.
Bitcoin Cash price is at the helm of a breakout, boosted by a generally bullish cryptocurrency market. The largest cryptocurrency, Bitcoin (BTC), topped $21,200 after a move of 4.80% on Friday. The crypto market is mostly dotted in green, with Ethereum trading at $1,664. BCH looks forward to extending its bullish leg to $158, but first buyers need to overcome the resistance at $125.
Bitcoin Cash price explodes out of a falling wedge
After massive declines that culminated in the Bitcoin Cash price holding support at $95.00 in June, a recovery followed that lifted the price in late July. The lack of buying pressure caused by unfavorable global economic conditions led to a widespread retracement across the crypto market – and BCH was not spared.
A prolonged downtrend, as observed in the daily chart below, suppressed the frequent reversal attempts made by bulls. The formation of a falling wedge pattern could finally mark the end of Bitcoin Cash’s troubles.
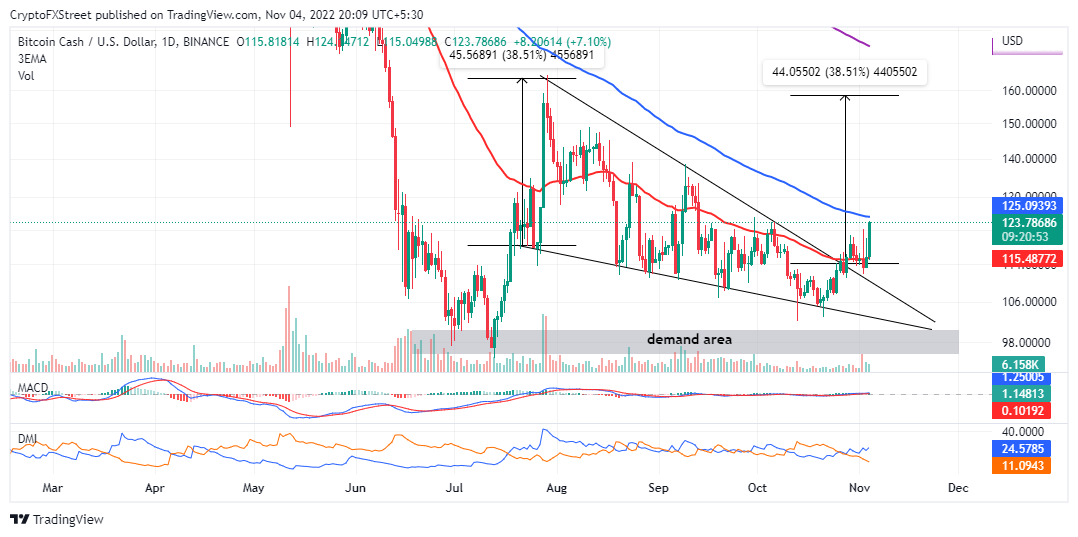
BCHUSD Daily Chart
A falling wedge pattern occurs when an asset price falls between falling support and resistance trend lines. The pattern is strongly bullish and often signals the end of a prolonged downtrend or the continuation of an uptrend.
However, there must be more than the appearance of this pattern to confirm a bullish breakout. Therefore, traders must delay triggering long positions until the price breaks above the upper trendline, as seen with Bitcoin Cash.
A 38.51% move to $164 has been foreshadowed as BCH climbs the ladder above the wedge pattern. This profit target corresponds to the distance between the widest points of the pattern and is extrapolated above the breakout point of $114.
The Moving Average Convergence Divergence (MACD) and Directional Movement Index (DMI) indicators reinforce the bullish outlook in the Bitcoin Cash price after displaying important positive signals recently.
Bitcoin Cash price is sitting on top of robust support, as highlighted by IntoTheBlock’s IOMAP model. From the chart below, about 441,000 addresses bought about 139,400 BCH between $114 and $117.
-638031743215403564.png)
Bitcoin Cash IOMAP Chart
As long as investors in that range steadily support Bitcoin Cash’s potential move to $164, a short-term trend reversal won’t be harmful. Furthermore, the same model reveals weakened resistance – a situation that could further strengthen the uptrend.
Nevertheless, care must be taken to avoid abrupt withdrawal. A daily candlestick near the 100-day exponential moving average (EMA) will take a long time to cement the bull’s influence on the price.
Conversely, BCH will bow to overhead pressure if the price fails to close the day above the moving average. Short-term sell orders can prove profitable, with the 50-day EMA (in red) as a potential profit target.


