How will Bitcoin price react to another 75 basis point increase?
- Bitcoin price is currently retesting the $21,710 support confluence.
- If bears break down the mentioned level, BTC could crash by 12%.
- A daily candlestick closing below $21,710 would trigger an 11% crash to $19,286.
The Bitcoin price is increasing in sell-side activity, which has led to a decline after almost a week of gains, starting on July 13. Now BTC has reached a level that will determine the fate and perhaps the directional bias of altcoins.
While the technicals paint an “on the fence” picture of the markets, one can guess whether it is from expectations of a rate hike scheduled to take place on July 27. This behavior makes sense, considering the previous interest rate hikes have generally sent crypto markets higher.
On July 13, the Fed raised interest rates by 75 basis points, sending BTC down 5%, but the short-term loss was eventually offset as the Bitcoin price sparked a week-long rally that pushed it from $19,000 to $24,000.
Investors must therefore pay close attention to how the markets will react on 27 July.
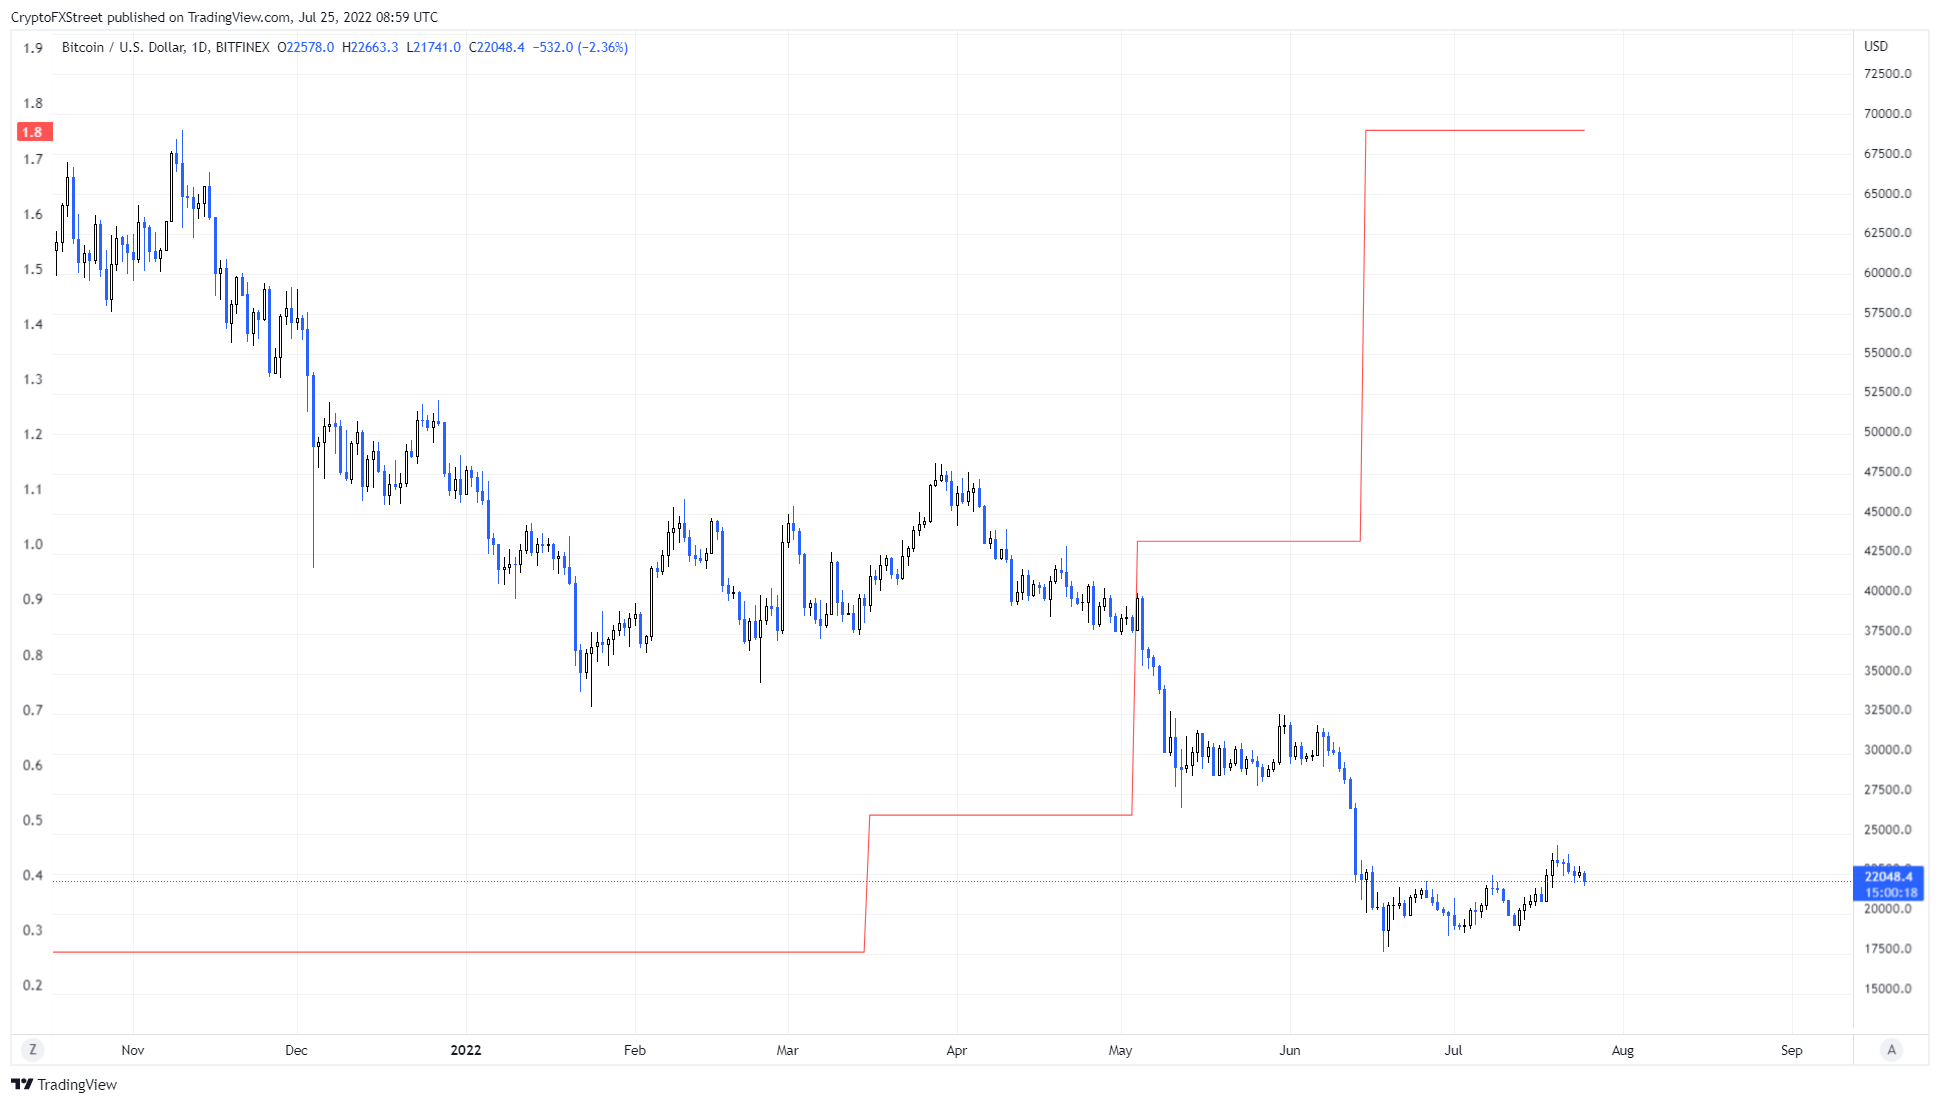
BTC/USD vs interest rate chart
Bitcoin price at a make-or-break point
Bitcoin price produced a daily candlestick close below the 200-week SMA on July 22. This development indicates that there is a weakness among buyers. Since then, BTC has fallen 4% and is currently hovering around $21,943.
Regardless of this decline, the bulls have another chance to recover due to the presence of the 30-day exponential moving average (EMA) at $22,010 and above 100 four-hour Simple Moving Average (SMA) at $21,562.
When the Feds move to raise interest rates by another 75 basis points, investors can expect volatility. A short sweep of $21,710 should be expected, but a quick recovery should indicate bullish sentiment.
A bounce from the aforementioned level could trigger a run to the $25,000 level after a 15% rally. This level is more likely to form a local top than the current one at $24,276.
However, traders should keep their minds open for an extension of this move to the $28,000 to $30,000 area in a very bullish case.
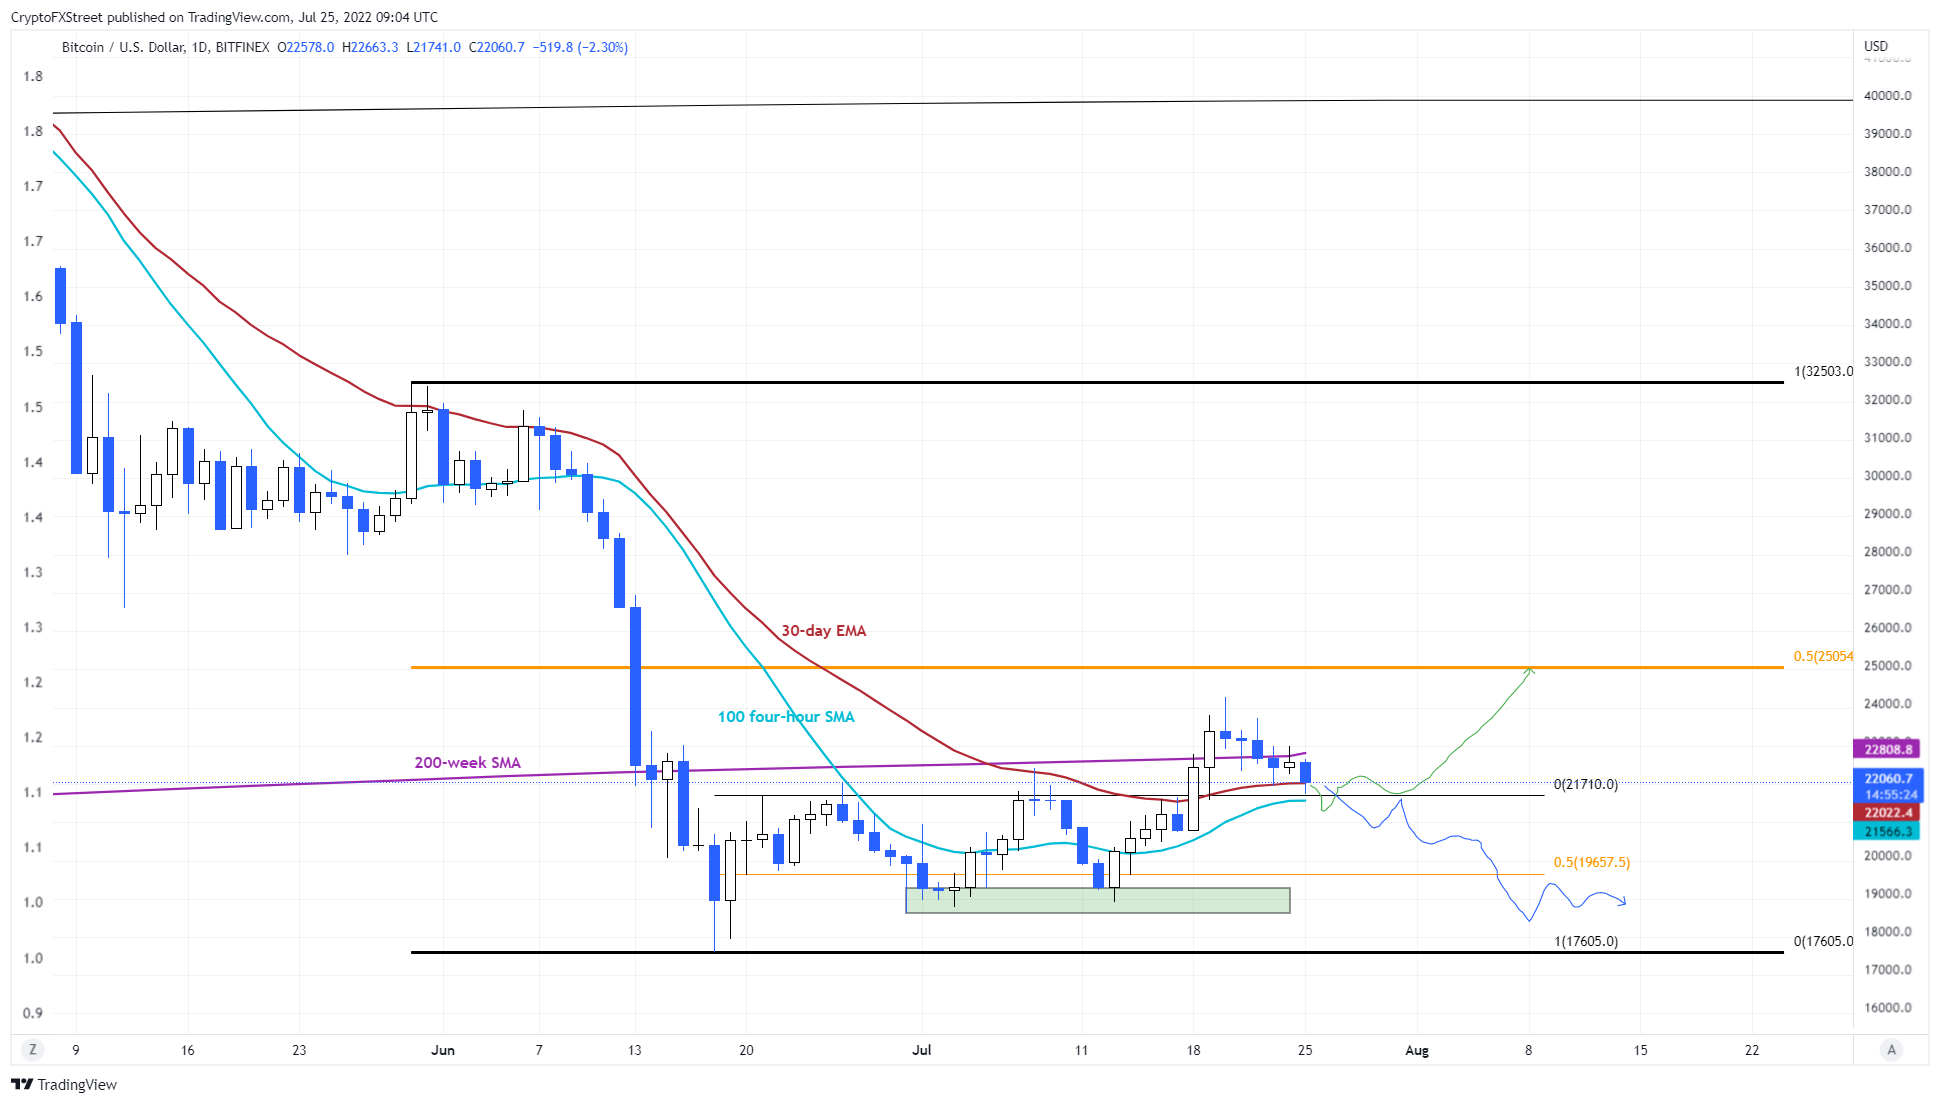
BTC/USD 1-Day Chart
On the other hand, if the Bitcoin price breaks below the support confluence of $21,710, there is a good chance that BTC may go back to the support level of $19,657. A breakdown of this level could cause BTC to retest the liquidity pool, extending from $18,638 to $19,286. In some cases, a sweep of the area low at $17,605 is also plausible.


