BTC shows potential for a recovery rally

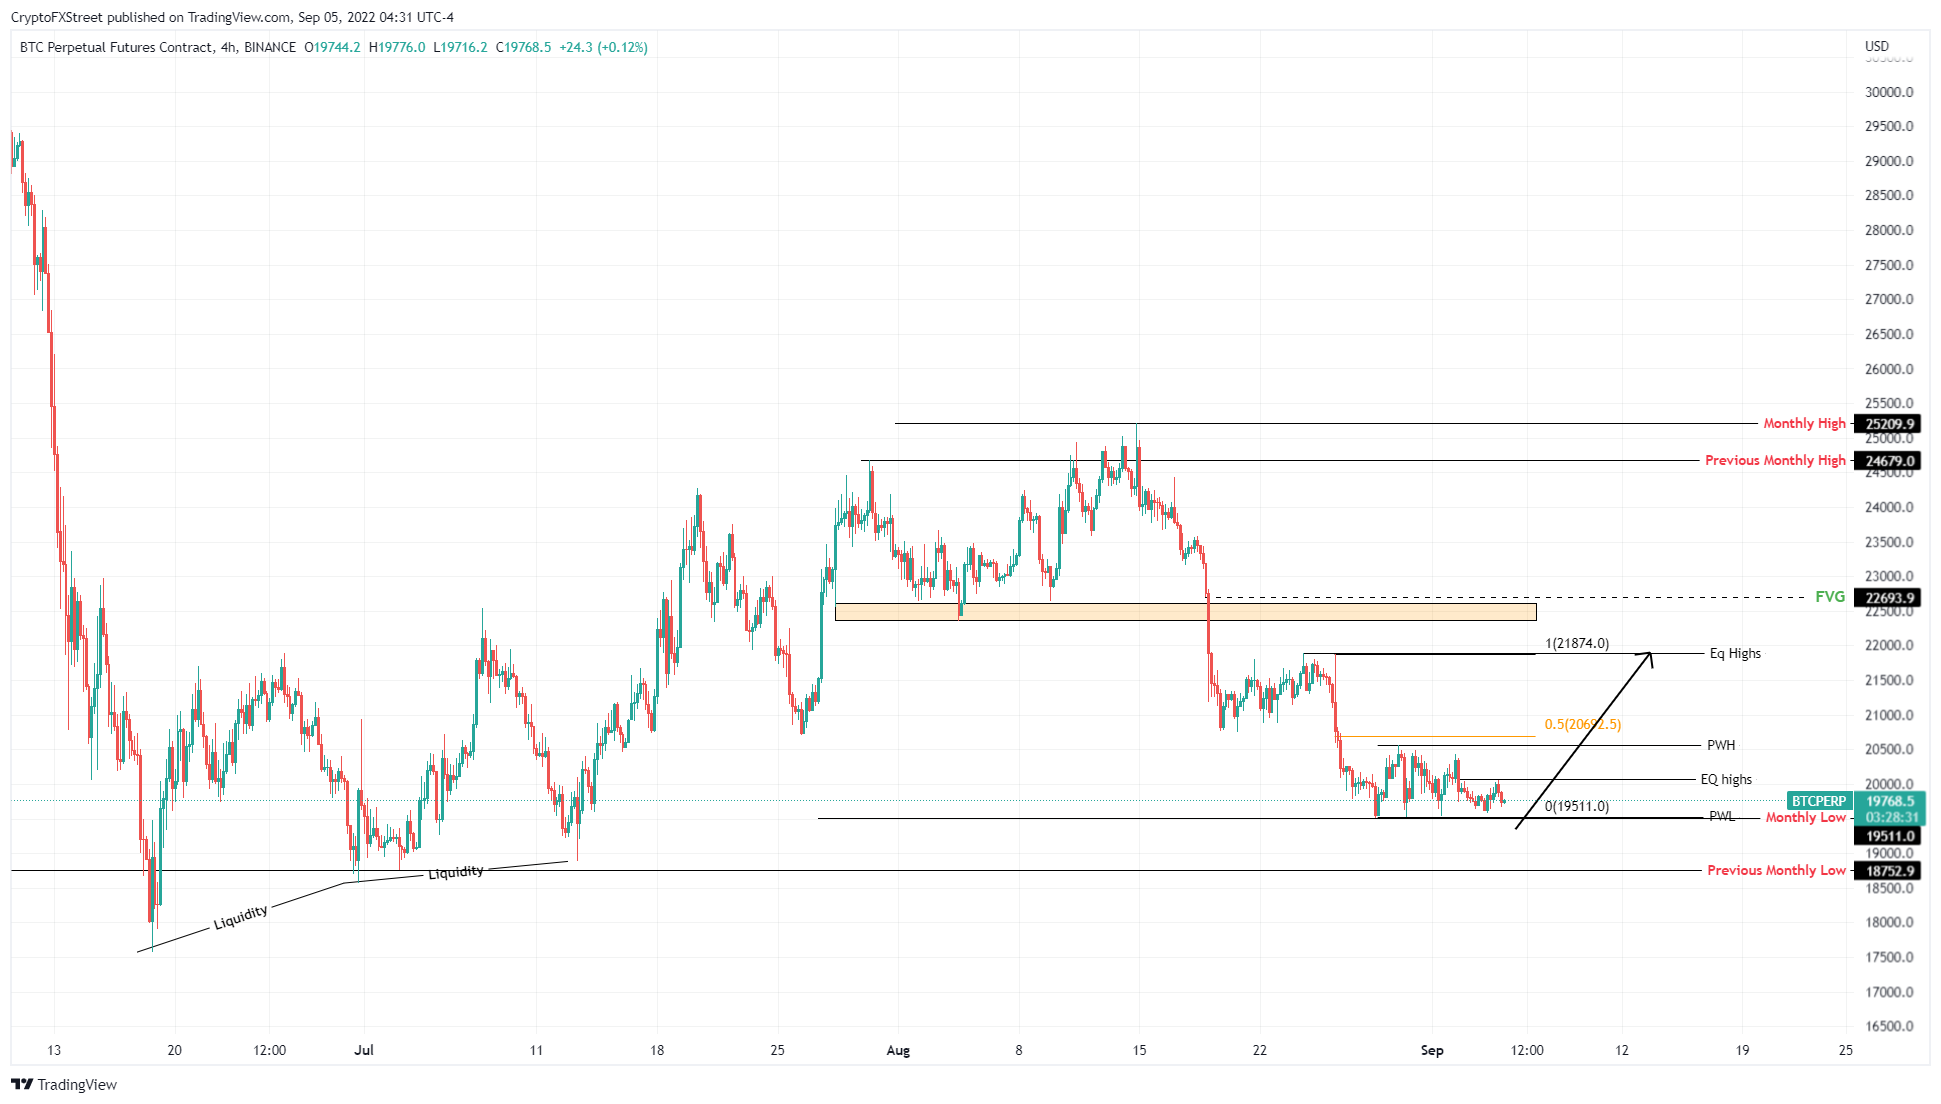
- Bitcoin price continues to struggle, but a sweep to $19,511 followed by a quick recovery could trigger a recovery rally to $20,692 and $21,874.
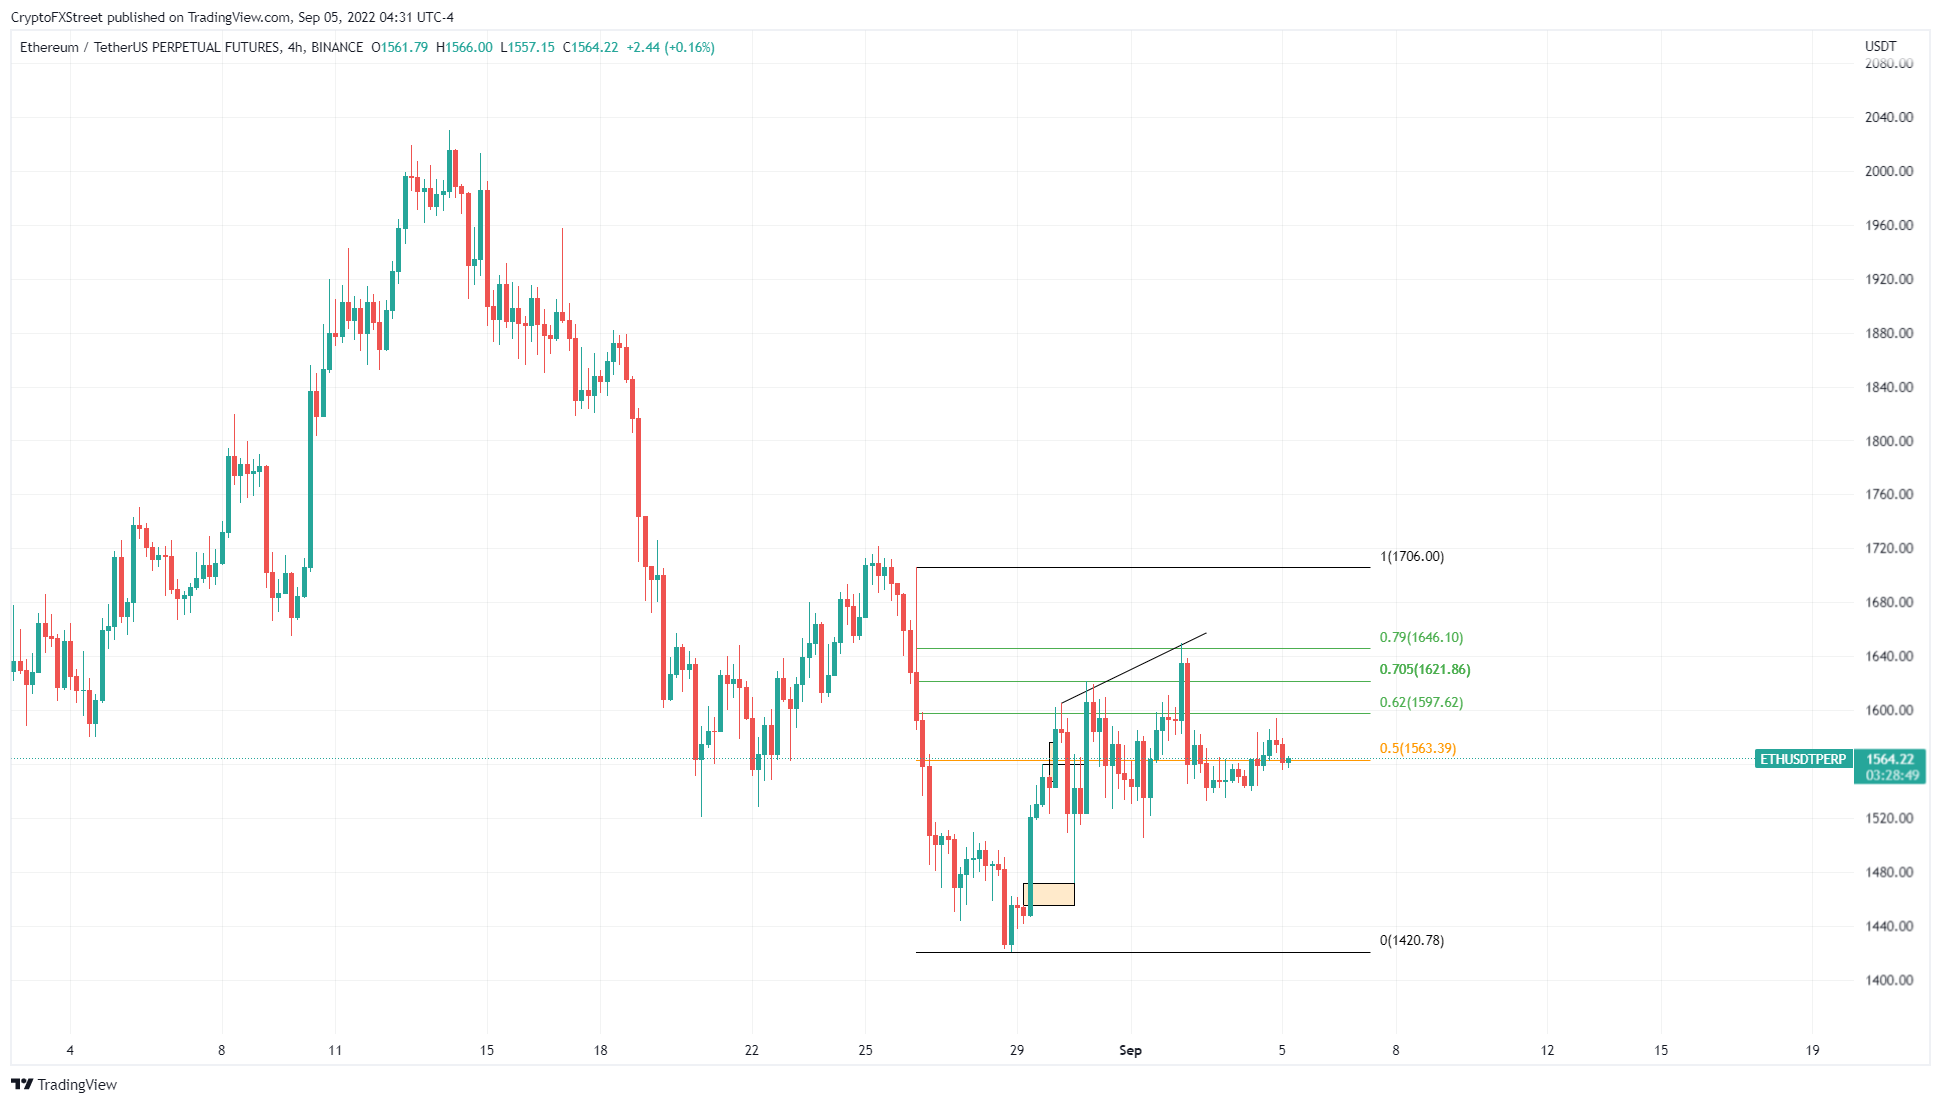
- Ethereum price follows Bitcoin’s footsteps and could fall to $1,471 to fill the imbalance.
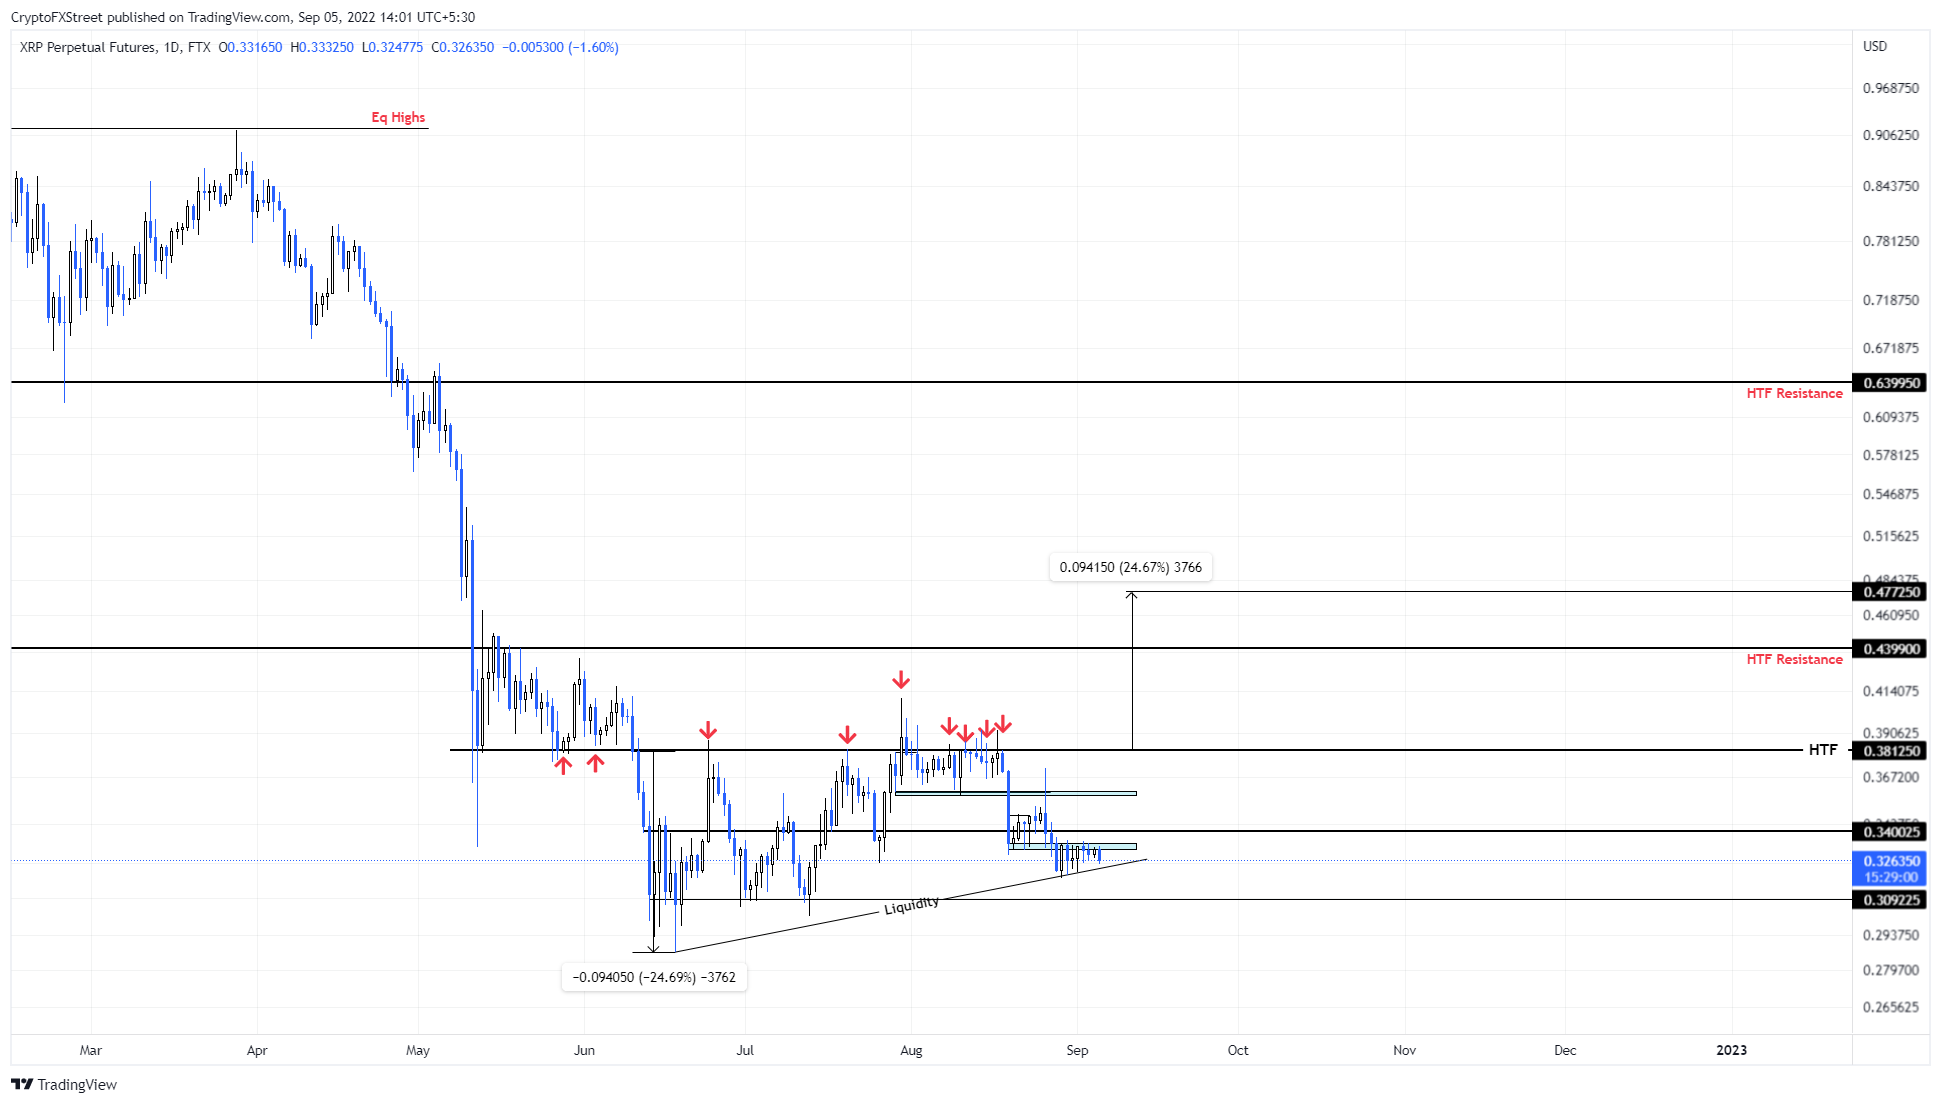
- Ripple price is showing an ascending triangle formation predicting a 25% break from a long-term perspective.
The Bitcoin price is revealing a bearish start to the week, which will allow market participants to collect the long-awaited sell-stop liquidity. This development is extremely important as it could set the stage for an upcoming BTC and altcoin-wide mining rally.
Bitcoin price suggests volatility
Bitcoin price has made similar lows at $19,511, which also coincides with the August low, making it an extremely important level to watch out for. A sweep of the aforementioned barrier could provide the buy signal for a recovery rally, which would be mainly driven by a retracement to the average price after a 10% crash.
In such a case, investors can expect the Bitcoin price to rise to $20,692, which is the midpoint of $21,874 to $19,511. However, clearing this obstacle would lead to a sweep of the $21,874 level.

BTC/USD 4-hour chart
While things look promising for the Bitcoin price, a daily candlestick close below $19,511 could invalidate the recovery rally. This development will also invalidate the bullish thesis and could crash further to $18,752.
Ethereum price is sending bearish signals
Ethereum price follows Bitcoin price and tries to break below the 50% Fibonacci retracement level of $1,563. If successful, it would confirm a bearish breakout and trigger a minor pullback to $1,531.
Depending on the selling pressure, the Ethereum price could visit $1505 and fill the imbalance, which extends from $1471 to $1454.

ETH/USD 4-hour chart
On the other hand, if the Ethereum price turns high at $1,706 to a support floor, it will invalidate the bearish thesis. This development could see ETH revisit $1730 and in some cases $1800.
Ripple price ready to make a big move
Ripple price has produced three distinctive higher lows and five similar highs at $0.381 since June 13. Connecting trend lines to these pivot points reveals an ascending triangle. This technical formation predicts a 25% rally, determined by adding the distance between the first swing high at the swing low to the breakout point of $0.381.
However, the Ripple price and its journey northward will face a hurdle at $0.439 and clearing this level will put the $0.477 target in reach.

XRP/USD 1-Day Chart
Regardless of the bullish outlook, investors should prepare for a sweep of the August 29 low at $0.318. However, a twist at this level, creating a lower low with no recovery, will invalidate the bullish thesis for Ripple price.


