What’s Next for Bitcoin After September Closes Below $20k?
Key takeaways:
- Bitcoin is down a sharp 25% from its August highs of $25,200
- BTC/USD closed the September monthly candle below the previous record high price
- Despite the bearish feeling, there is a slight increase in the number of new addresses
| BTC price | $19,255* |
| Important support levels | $19,000, $18,585, $18,400, $18,000, $17,830, $17,160, $16,615, $16,000, $15,700, $15,315 |
| Important resistance levels | $19,575, $19,720, $20,000, $20,500, $20,700, $21,000, $21,600, $22,650 |
*Price at time of publication
Bitcoin is now down a total of almost 25% from its August highs of $25,200, as the cryptocurrency continues to struggle in a tight range between the low of $18,160 and the high of September of $22,800. In fact, the upper angle of the range has been much tighter over the past nineteen days as BTC failed to post a daily closing candle above the $20,000 resistance.
The bearish sentiment is largely a result of the overall inflation narrative, with the US Federal Reserve continuing to raise interest rates in September by another 75 BPS, bringing the current US Fed Funds rate to 3.25%.
The Fed’s restrictive monetary policy appears to be the main reason for Bitcoin’s poor performance
This narrative has consistently plagued the market with bearish pressure as investors continue to wait on the sidelines for further clarity on how high interest rates may play out. Most traders continue to keep an eye on the CPI, hoping to see a reduction that indicates inflation is starting to fall, with the next CPI announcement scheduled for October 13.
The inflation narrative is sending shockwaves across the financial sector, with major indexes like the SP500 and NASDAQ losing crucial ground last week and making fresh new lows for 2022.
Although BTC/USD has still not made a new low for 2022, the monthly candle for September closed below the previous record high price seen towards the end of 2017, raising doubts that the weekly 200-SMA at $18,000 will sustain the move going forward . This was noted by prominent analyst Cyber David Trading, who has over 60,000 members in his group. David is now aiming for $14,000 if the $18,000 support doesn’t hold.
If BTC continues to fall, traders will continue to look to the weekly 200-SMA for support. The weekly 200-SMA supported the market during the price collapse in May, and traders are now looking back to that level for support going forward. It currently stands at $18,000.
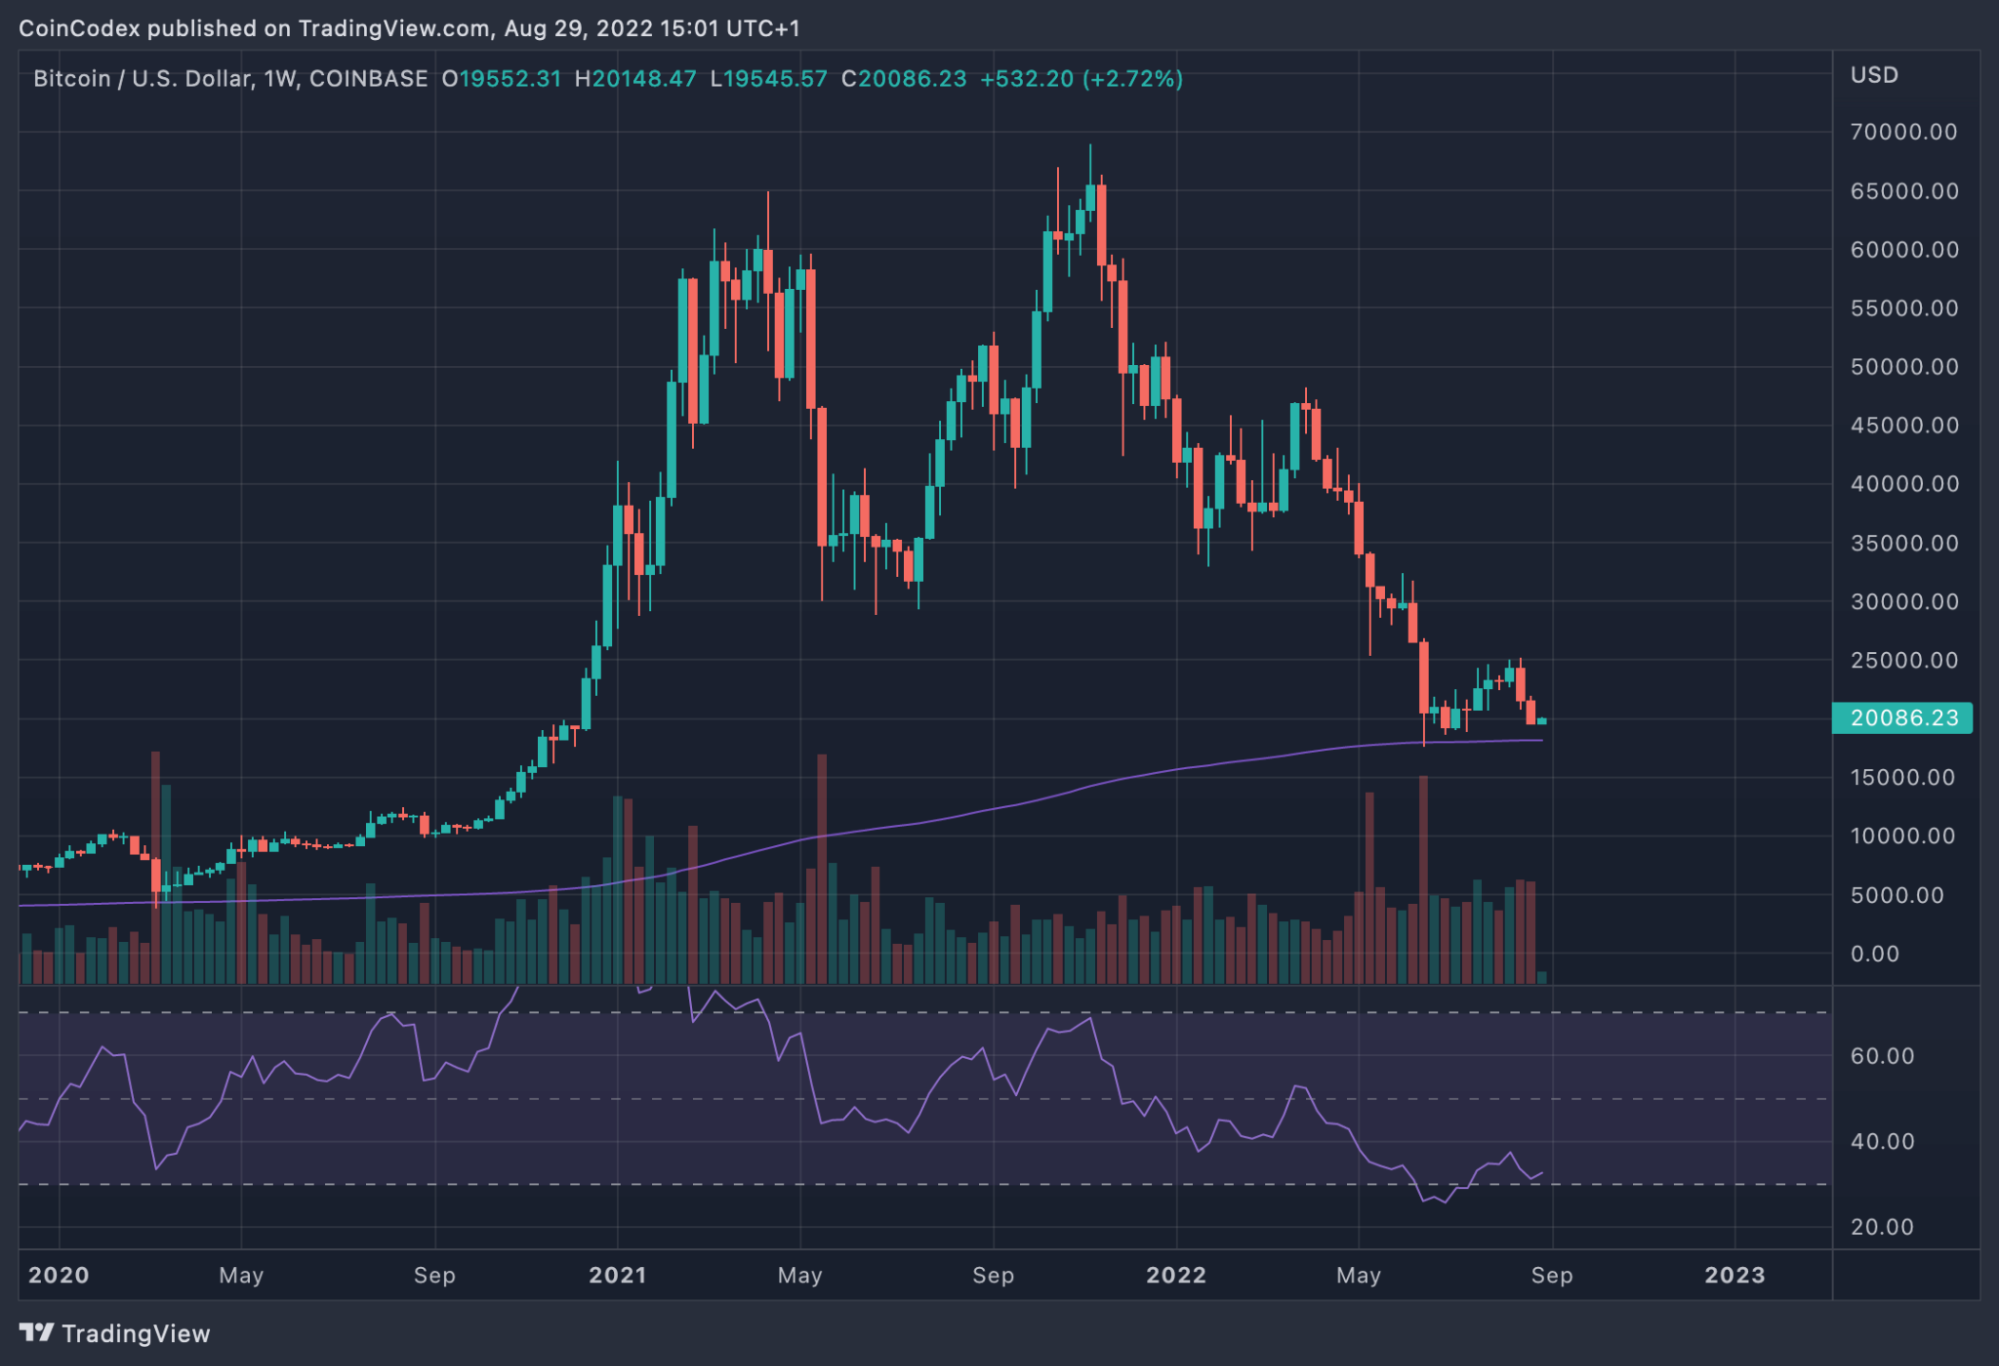
Image source: TradingView
Despite the general bearish sentiment, few analysts are starting to release some potentially positive outlooks and share positive bits of Bitcoin news after a while. For example, InvestAnswers recently reminded its 440,000 YouTube subscribers that October is historically a bullish month for BTC. The average monthly return is 28.42%, pushing BTC up between $25,000 and $26,000 if the same return were to play out. According to past returns, October is the third best bullish month and is often referred to as “Uptober”.
Finally, a more interesting metric to keep an eye on is the fact that the number of new addresses is up from mid-July, showing that there may be some retail interest in the market.
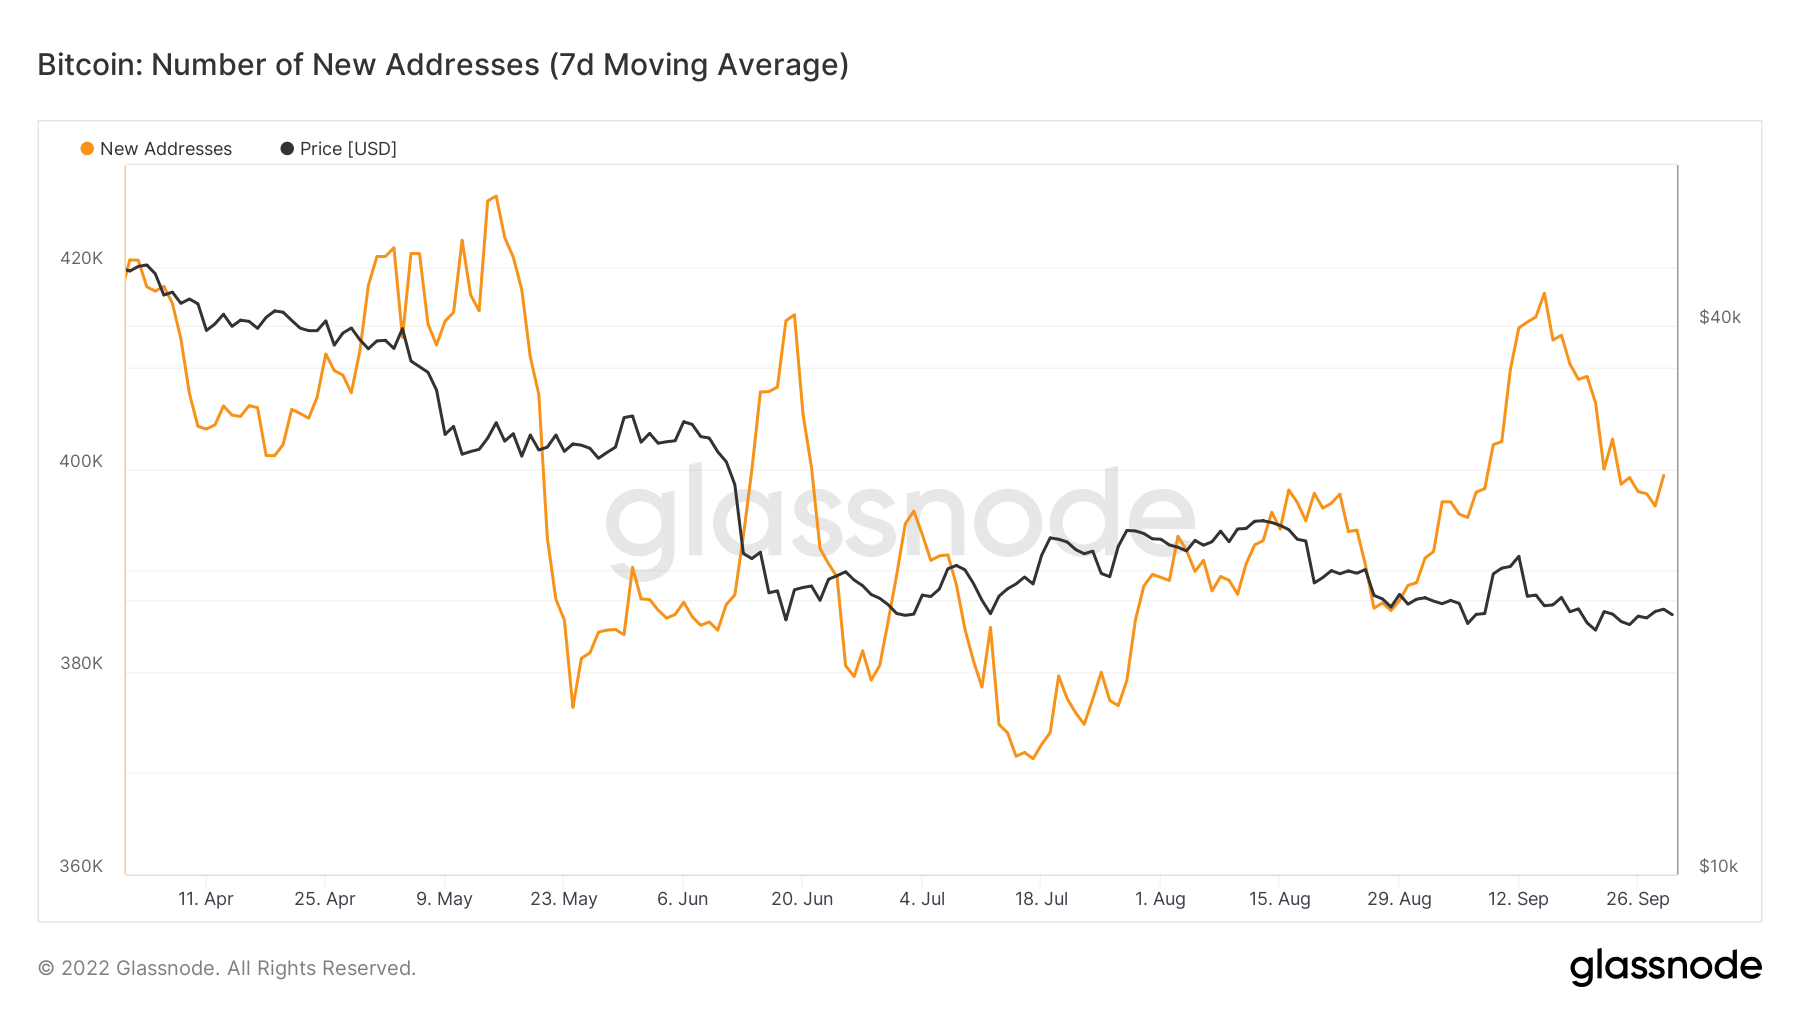
Image source: Glassnode
Still, if the CPI reading for October comes out quite high, that could send more bearish pressure across the market and potentially send the market below $18,000.
With that in mind, let’s take a closer look at the charts and see the potential support and resistance areas going forward.
Bitcoin price analysis
Let’s pair fundamental analysis factors outlined above with technical indicators consisting of BTC price and Bitcoin chart analysis to see what may be in store for the world’s oldest crypto on short and long term time scales.
Bitcoin to USD Daily BTC Chart
Bitcoin has changed hands in a narrow price channel between $19,000 and $19,500 to start October. Although it can be very difficult to predict Bitcoin prices, technical data shows that if BTC were to lose $19,000, a sudden drop to the next support level of $18,000 is very likely.
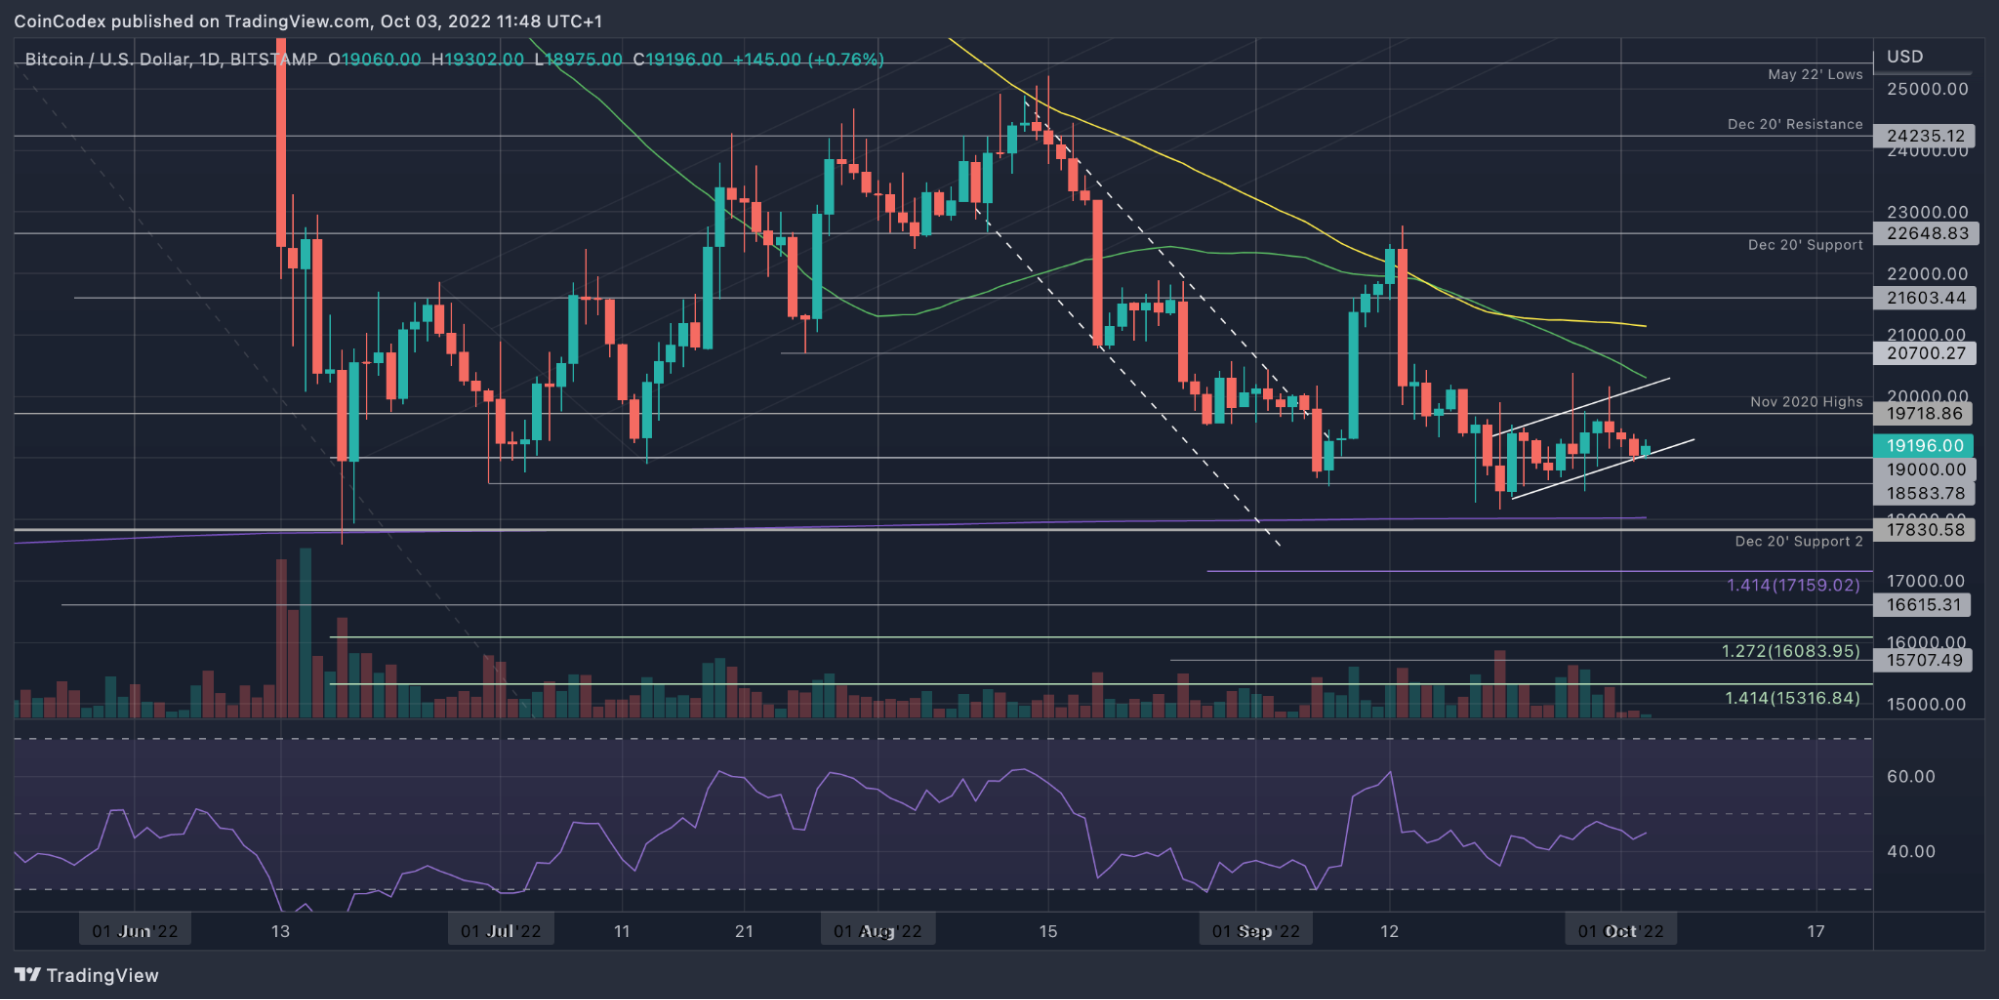
Image source: TradingView
Bitcoin to USD 4 Hour BTC Chart
The 4-hour BTC chart shows the range-bound trading activity even more clearly than the daily Bitcoin chart. According to our Bitcoin analysis, Bitcoin’s short-term future price outlook depends on the crypto’s ability to hold $19,000-$18,000. If trading above the crucial support does not hold, a drop to $15,000-$14,000 is possible.
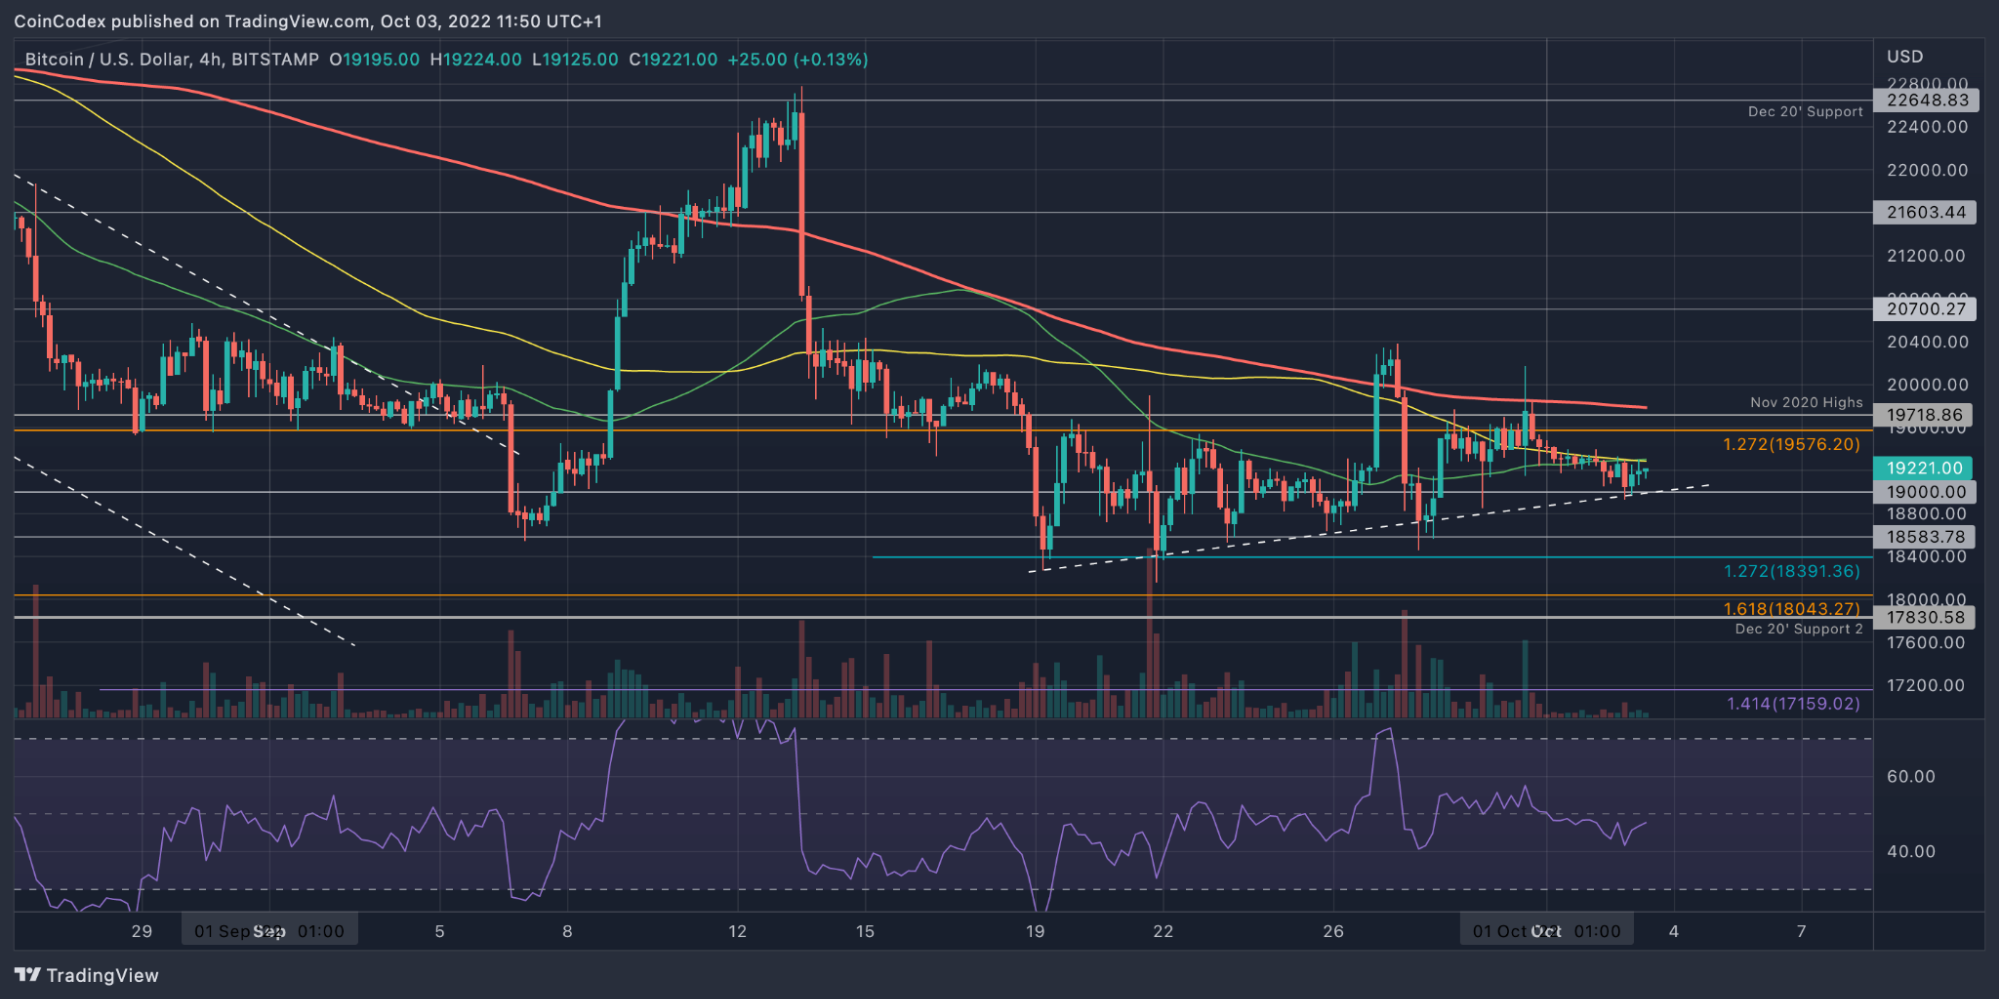
Image source: TradingView
What Happened to Bitcoin?
The daily chart above shows that BTC is trading within something of a bearish flag and fighting against the lower boundary of the channel. A break below this flag is likely to send BTC to the next major support level, which is at the weekly 200 SMA level at $18,000.
The market witnessed a brief bullish push higher in early September, allowing BTC to reach as high as $22,650 during the move. However, BTC fell from there and has been trapped within a range between $20,000 and the September low of $18,160 for the past 20 days or so.
BTC needs to break out of this area to dictate the next direction for the market. Despite the range-bound trade, it can be seen as slightly optimistic as it has not made a new low in 2022 as the major financial indices (SP500 & Nasdaq) did last week.
Bitcoin price in the short term: Bearish
In the short term, Bitcoin is now considered bearish. To become neutral, we need to see BTC rise above the $20,000 level. A break below the long-term support at $18,000 would send BTC into a bearish spiral down towards $15,000.
On the flip side, Bitcoin would have to break above the resistance at $22,650 to initiate a new short-term bullish trend. A break above the August highs above $25,000 would confirm a bull trend that could be sustained for an extended period.
Where is BTC headed and what can you expect in Bitcoin’s future?
Unfortunately, there is no new information on where BTC might be headed next before the breakout of the current range. However, if BTC manages to close a daily candle above $20,000, this could be considered a good short-term bullish signal in the eyes of some retail traders.
Still, the CPI reading is on October 13 (10 days away), which could result in sideways action until then.
Looking ahead, the first resistance level lies at $19,720 (November 2020 highs) – BTC has failed to close above this level in the last 19 days. Above this lies resistance at $20,000. If buyers can rally to break $20,000, resistance at $20,700, $21,000 (100-day MA), $21,600 and $22,000 is expected.
Additional resistance is $22,650 (Dec 2020 support), $23,000, $24,235 (Dec 2020 resistance) and $25,000.
On the other side lies the first support level at $19,000 (the lower limit of the current flag). Below this lies support at $18,585, $18,000 (weekly-200 SMA), $17,830 (December 2020 support) and $17,160 (downside 1,414 Fib Extension).
Additional support is at $16,615, $16,000 and $15,700.
According to our automated BTC price prediction algorithm, the world’s largest crypto could fall as low as $13,950 in the next three months. However, the long-term outlook looks far more promising, with the price of BTC reaching $37,800 in the next 12 months.


