Long-term holder supply rises to near ATH
Data shows that the supply of Bitcoin’s long-term holders has increased recently to near all-time highs as these “diamond hands” increase their holdings.
Long-term Bitcoin holder supply increases by 250k BTC after recent low
According to the latest weekly report from Glassnode, the current total balance of the long-term owners is only 30k away from ATH.
The “long-term holders” (or LTHs for short) are a group of Bitcoin holders that includes all those investors who have held onto their coins since at least 155 days ago, without selling or moving them.
In general, the longer holders hold their BTC, the less likely they are to sell them. Because of this, LTHs are the least likely investor group to sell at any time.
The opposite cohort is the “short-term holders” (STHs), who have held their coins in their wallets for less than the 155-day limit.
Now the “LTH supply” is a measure of the total number of coins currently sitting in the wallets of the investors belonging to this group.
When the STH supply matures enough and reaches the threshold, these coins are naturally included in the LTH supply.
Here is a chart showing the trend of Bitcoin LTH supply over the last couple of years:
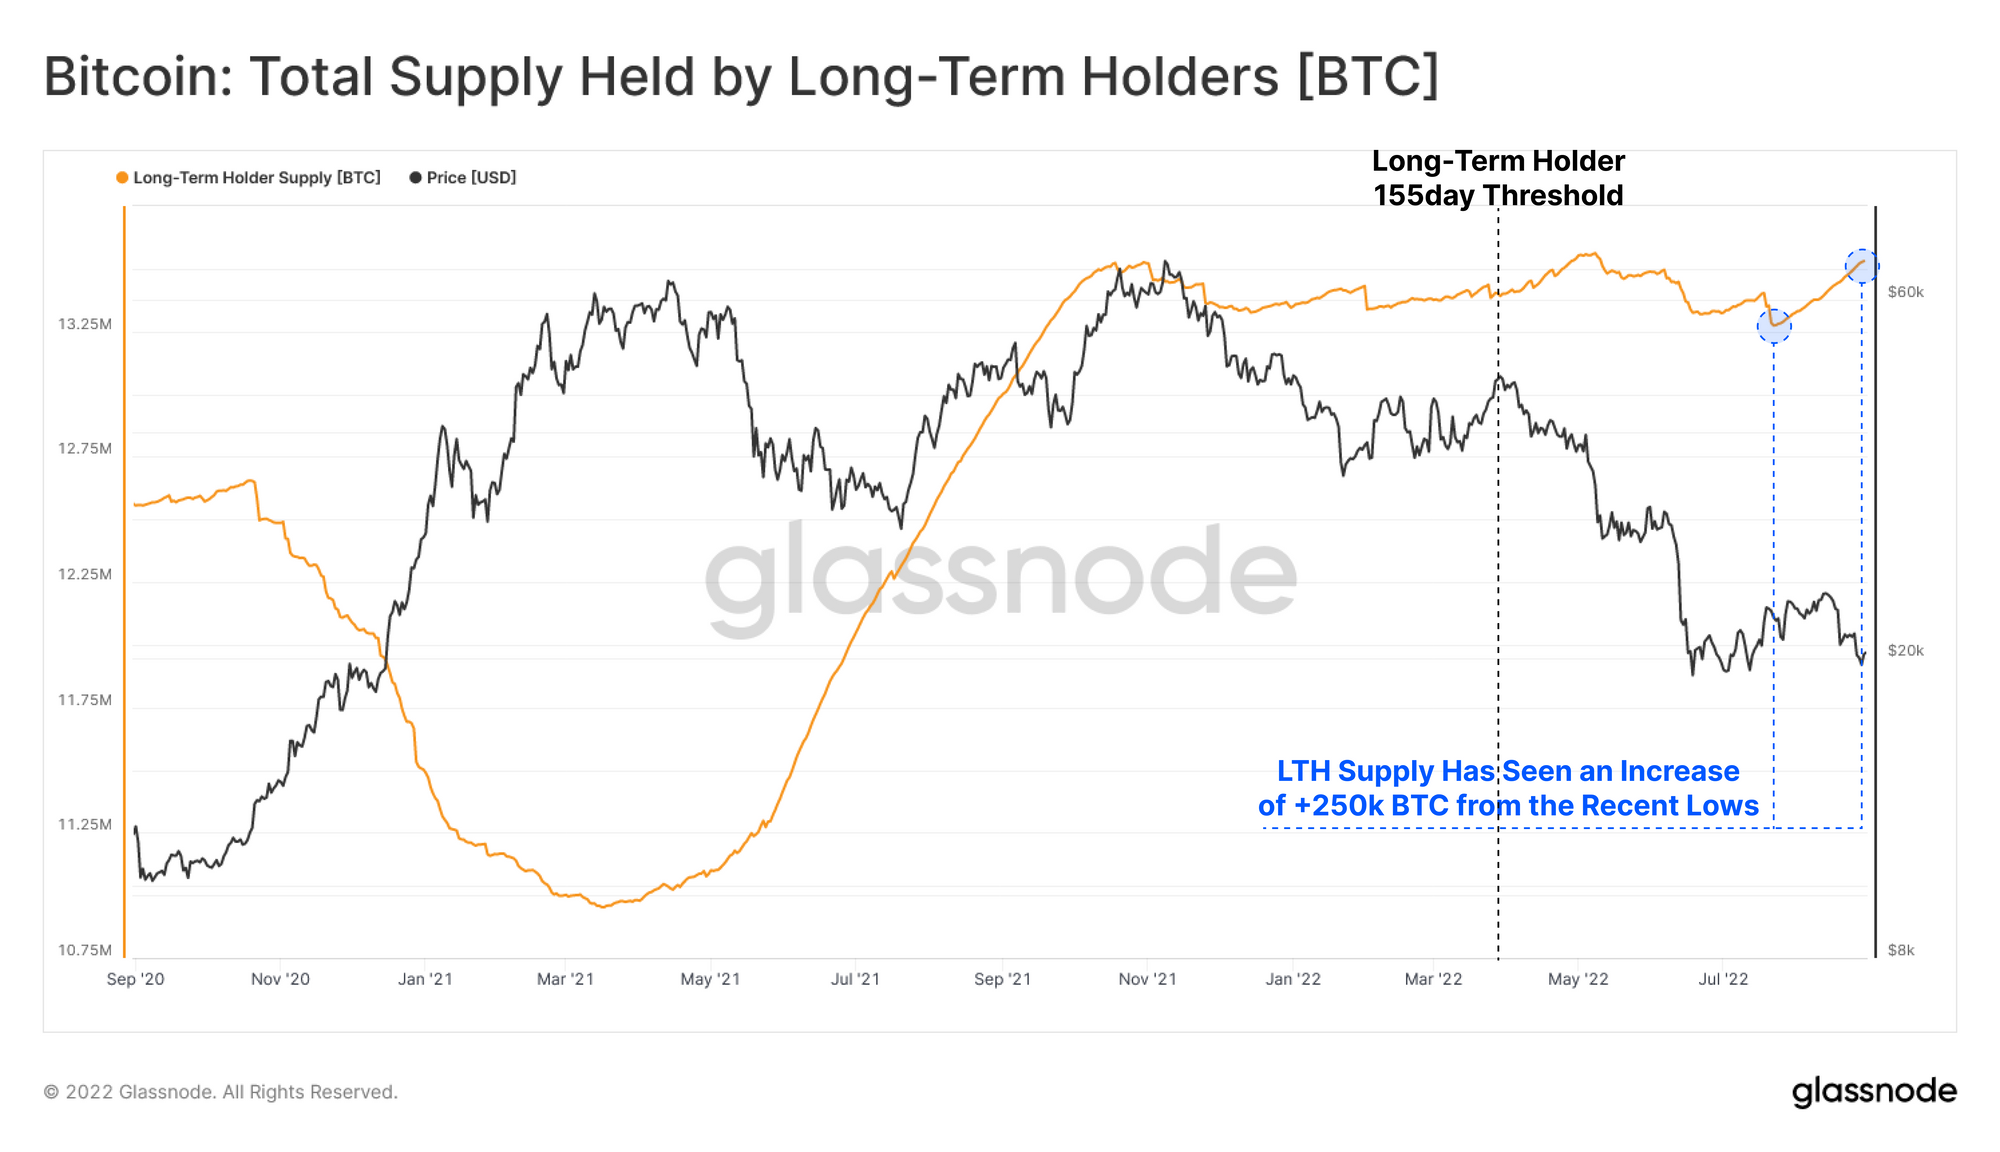
Looks like the value of the metric has been going up in recent days | Source: Glassnode's The Week Onchain - Week 36, 2022
As you can see in the graph above, Bitcoin LTH supply had been on the decline since the ATH and reached a low a while back.
However, in recent weeks, the indicator’s value has observed an increase. Since the low, LTHs have added around 250k BTC to their holdings.
The report notes that the 155-day threshold sets the minimum acquisition period for these investors to count as LTHs prior to the LUNA crash.
Because of this, the report believes that it is possible that the supply of these breeders will stagnate over the next month, or even until mid-October, when the threshold will have moved to the post-sale period.
BTC price
At the time of writing, Bitcoin’s price is hovering around $19.8k, down 1% in the last week. Over the past month, the crypto has lost 14% in value.
The chart below shows the trend in the price of the coin over the last five days.

The value of the crypto seems to have not moved much in the last few days | Source: BTCUSD on TradingView
Featured image from Aleksi Räisä on Unsplash.com, charts from TradingView.com, Glassnode.com


