Weekly Waves: EUR/USD, GBP/USD and Bitcoin
-
EUR/USD touched near 0.95 in early trade this morning, completing a wave 5 (green) of wave 3 (orange).
-
GBP/USD made a huge drop from 1.0850 down to 1.03 earlier this morning, which appears to be part of an impulsive wave 3 (yellow).
-
BTC/USD is in an important decision zone: a bearish breakout confirms the downtrend (red arrows).
EUR/USD bearish momentum takes a small break
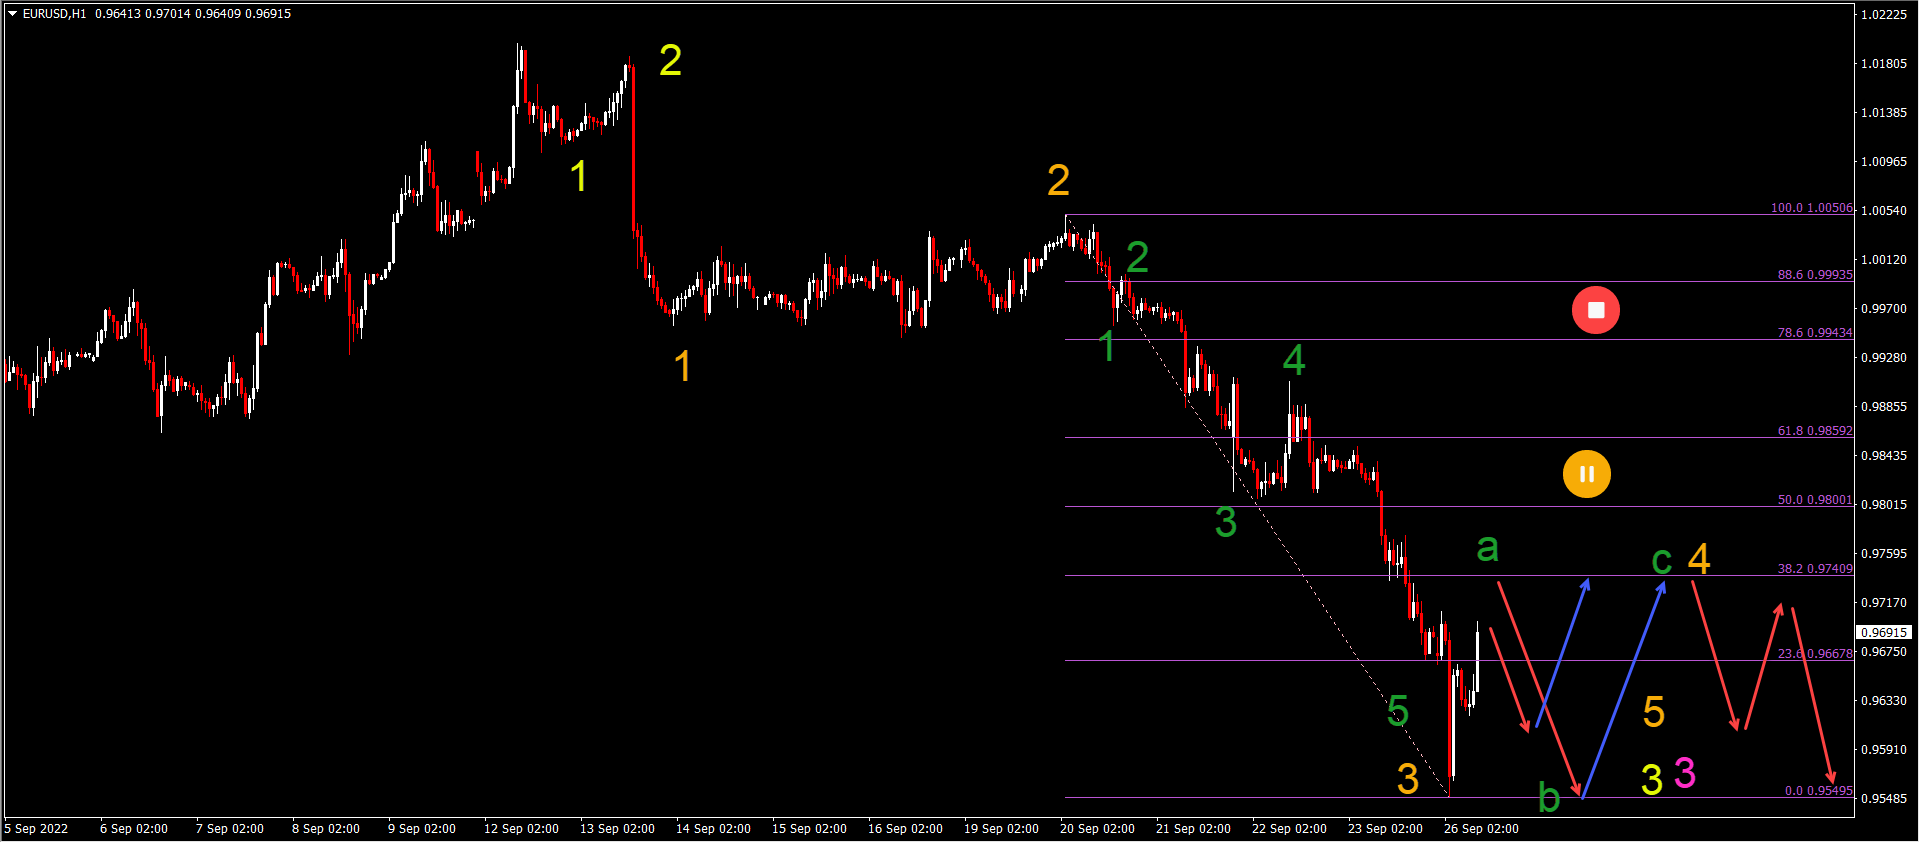
EUR/USD touched almost 0.95 in early trade this morning:
-
EUR/USD could have completed wave 5 (green) of wave 3 (orange).
-
The strong bullish retracement when the price action reached the strong support at the 0.95 round level is likely a wave A (green) retracement.
-
Price action may have trouble moving much higher. Fibonacci retracement levels should act as a strong resistance.
-
A bearish reaction to the Fibonacci levels can confirm the end of wave A and the start of wave B (green).
-
A larger ABC (green) pattern will fit within an expected wave 4 (orange).
-
A downtrend is expected to resume and initiate price action at 0.94 and 0.9250 within wave 5 (orange) of wave 3.
GBP/USD crashes 550 pips in early trade
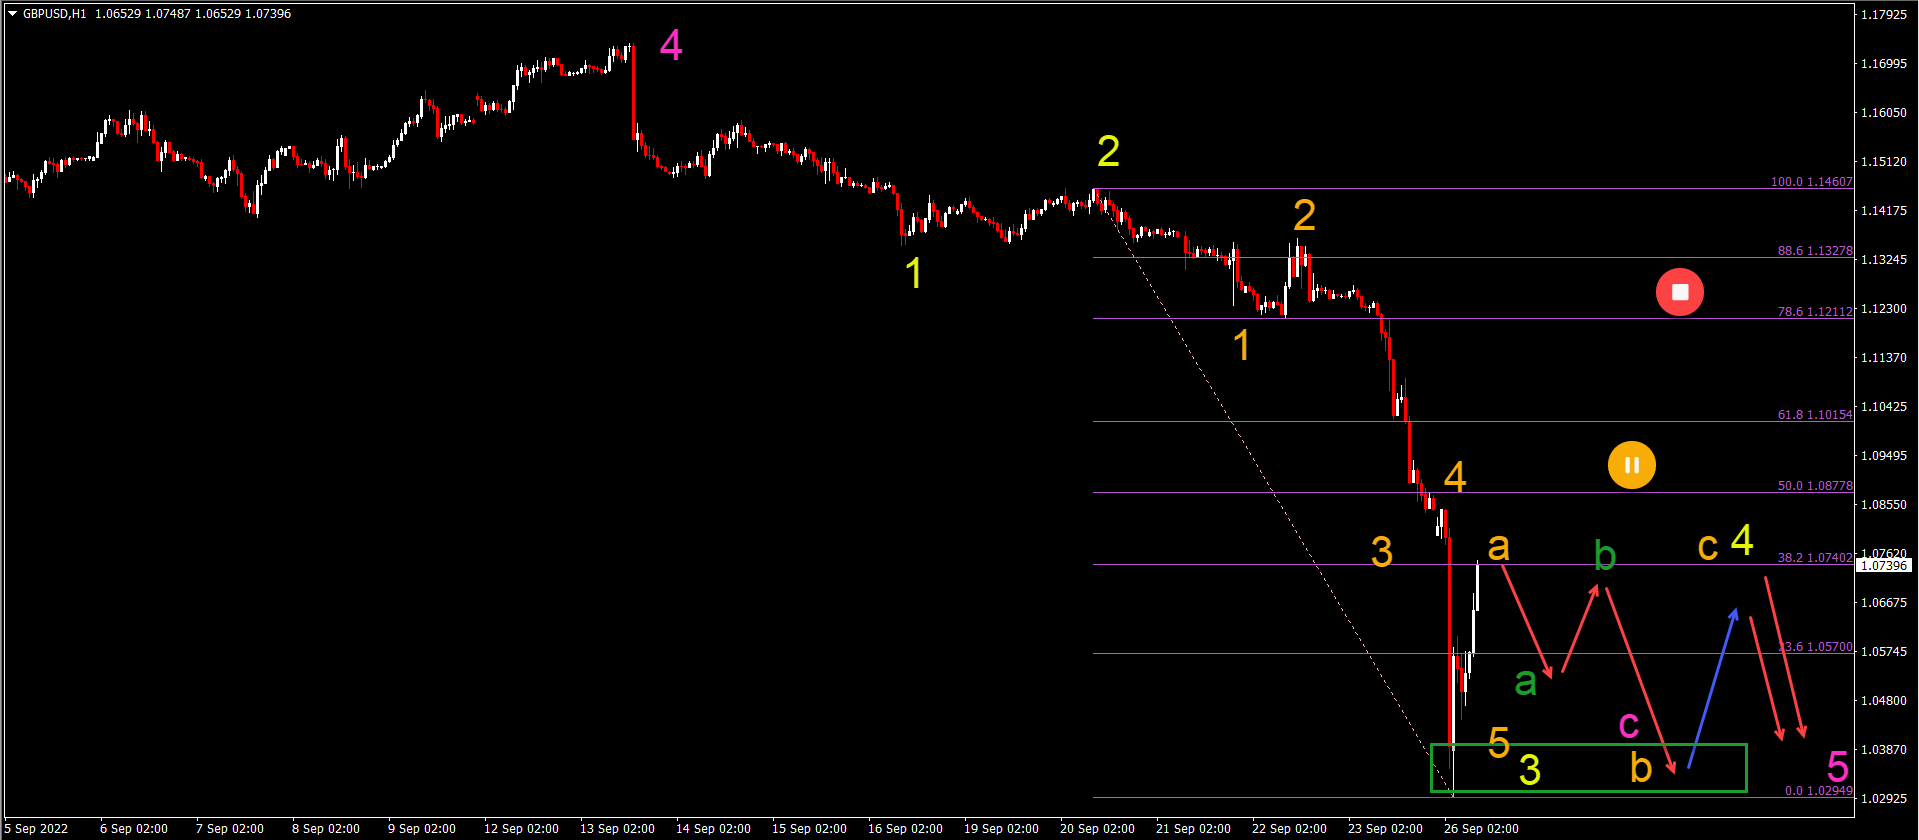
GBP/USD made a huge drop from 1.0850 down to 1.03 earlier this morning:
-
The decline at the GBP/USD 550 pip this morning appears to be part of an impulsive wave 3 (yellow).
-
The strong bullish upward push after the decline is expected to be a wave A (orange) of a larger ABC (orange) within a wave 4 (yellow).
-
The Fibonacci levels are expected to be a resistance zone.
-
A break above the 50% Fibonacci level makes it less likely that the current Elliott Wave analysis – which indicates a wave 3 and 4 (yellow) – is correct.
-
A bullish ABC (orange) is expected within wave 4 (yellow).
-
A continuation of the downtrend should aim for parity (1.00).
BTC/USD
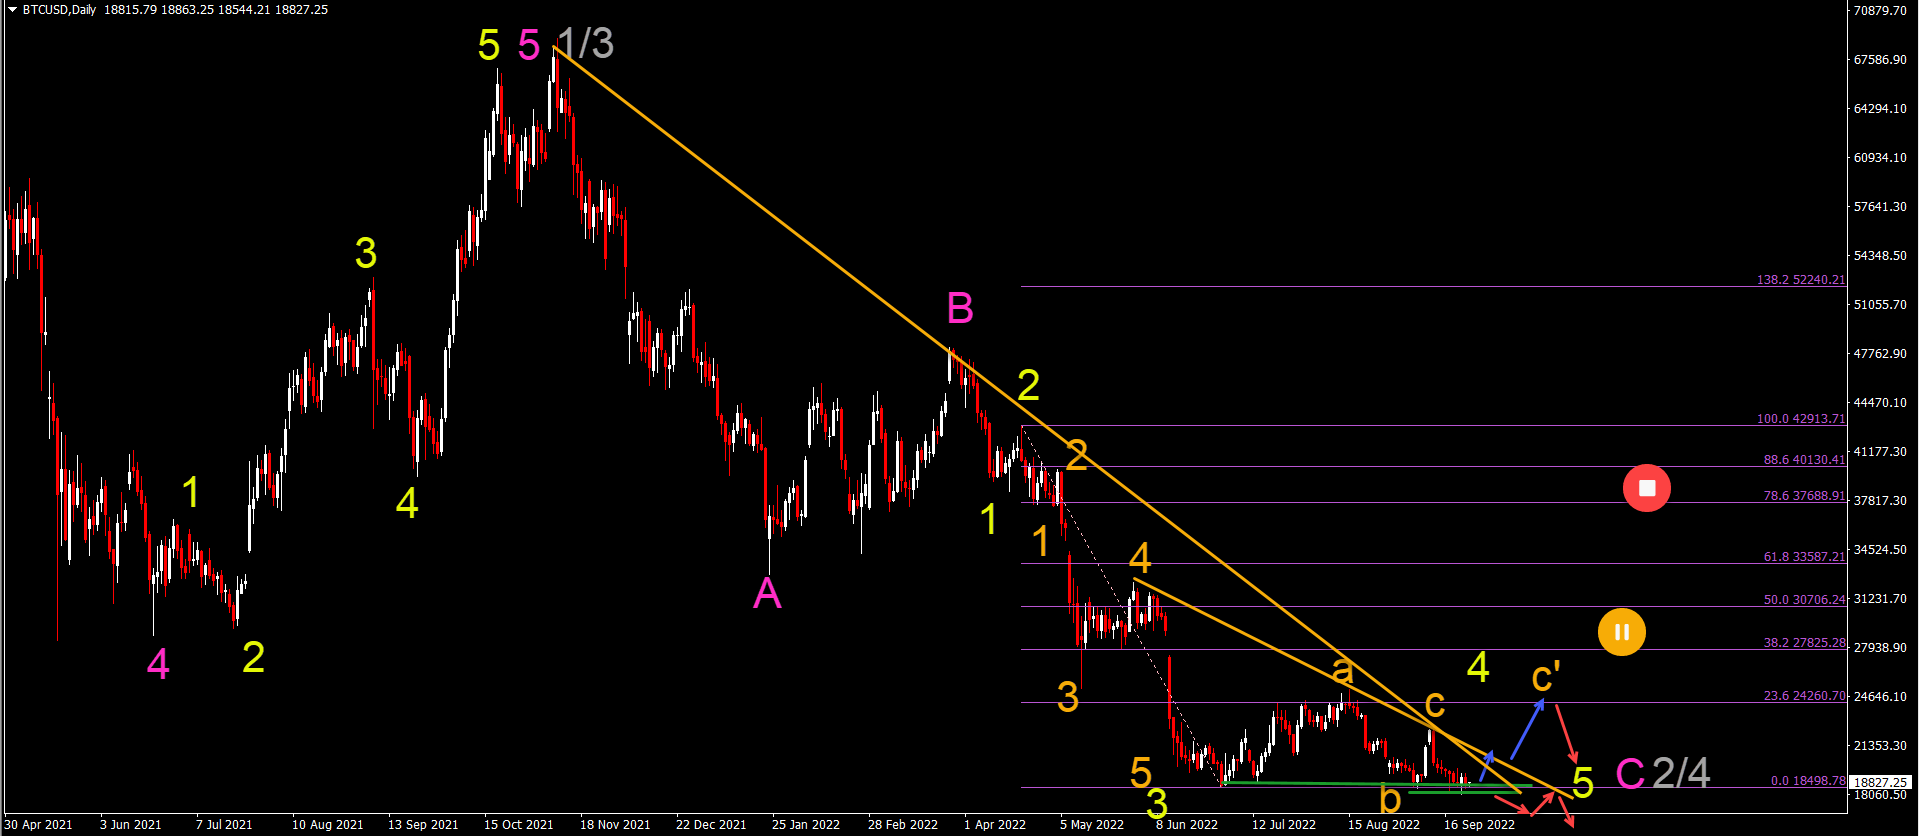
Bitcoin (BTC/USD) fails to break through the previous low (green lines):
-
BTC/USD is in an important decision zone: a bearish breakout confirms the downtrend (red arrows).
-
A bullish bounce (blue arrows) could indicate a larger wave C (orange C’) towards the 23.6% and 38.2% Fibonacci resistance zone.
-
A break above 38.2-50% Fibonacci levels may indicate that wave 5 (yellow) of wave C (pink) is complete.
-
A bearish bounce at the Fibonacci resistance levels should signal the end of wave 4 (yellow).
-
A continuation of the downtrend targets $15k and $12.5k within wave C (pink).
The analysis is done with the indicators and template from the SWAT method simple wave analysis and trading. For more daily technical and wave analysis and updates, sign up to our newsletter


