Weekly Waves: EUR/USD, Bitcoin and Gas
-
EUR/USD made a strong bullish bounce at the 78.6% Fibonacci support confirming the end of wave B (pink) and the start of wave C (pink).
-
Bitcoin (BTC/USD) builds a descending wedge chart pattern, which usually breaks bearishly.
-
NGAS made a bearish bounce at the 50% Fibonacci level, which is likely a bearish wave 4 (yellow).
EUR/USD bullish bounce at 78.6% Fib support
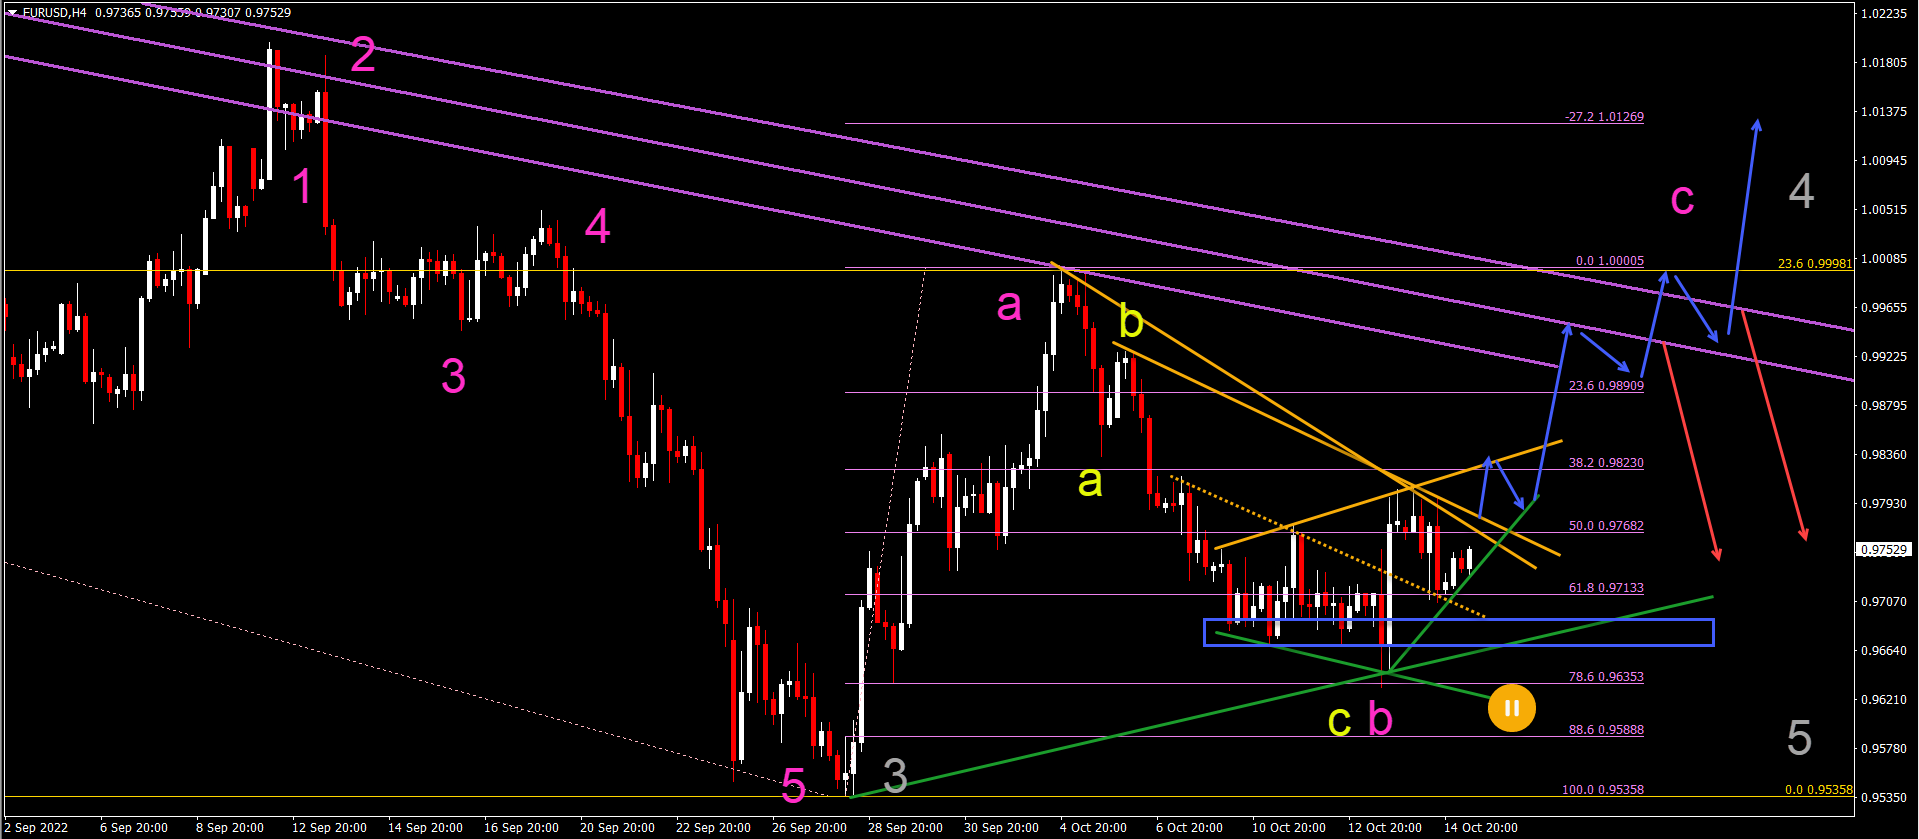
EUR/USD made a bullish retracement at the 78.6% Fibonacci retracement level:
-
EUR/USD appears to have completed an ABC (yellow) within a wave B (pink).
-
There was a strong bullish bounce at the 78.6% Fibonacci support confirming the end of wave B (pink) and the start of wave C (pink).
-
Price action must now break above the resistance lines (orange) to confirm continuation within wave C (pink).
-
ABC (pink) is expected to complete a wave 4 (grey).
-
A break below the 78.6% Fibonacci level indicates either a downtrend or complex correction within wave B (pink).
Bitcoin builds descending wedge pattern
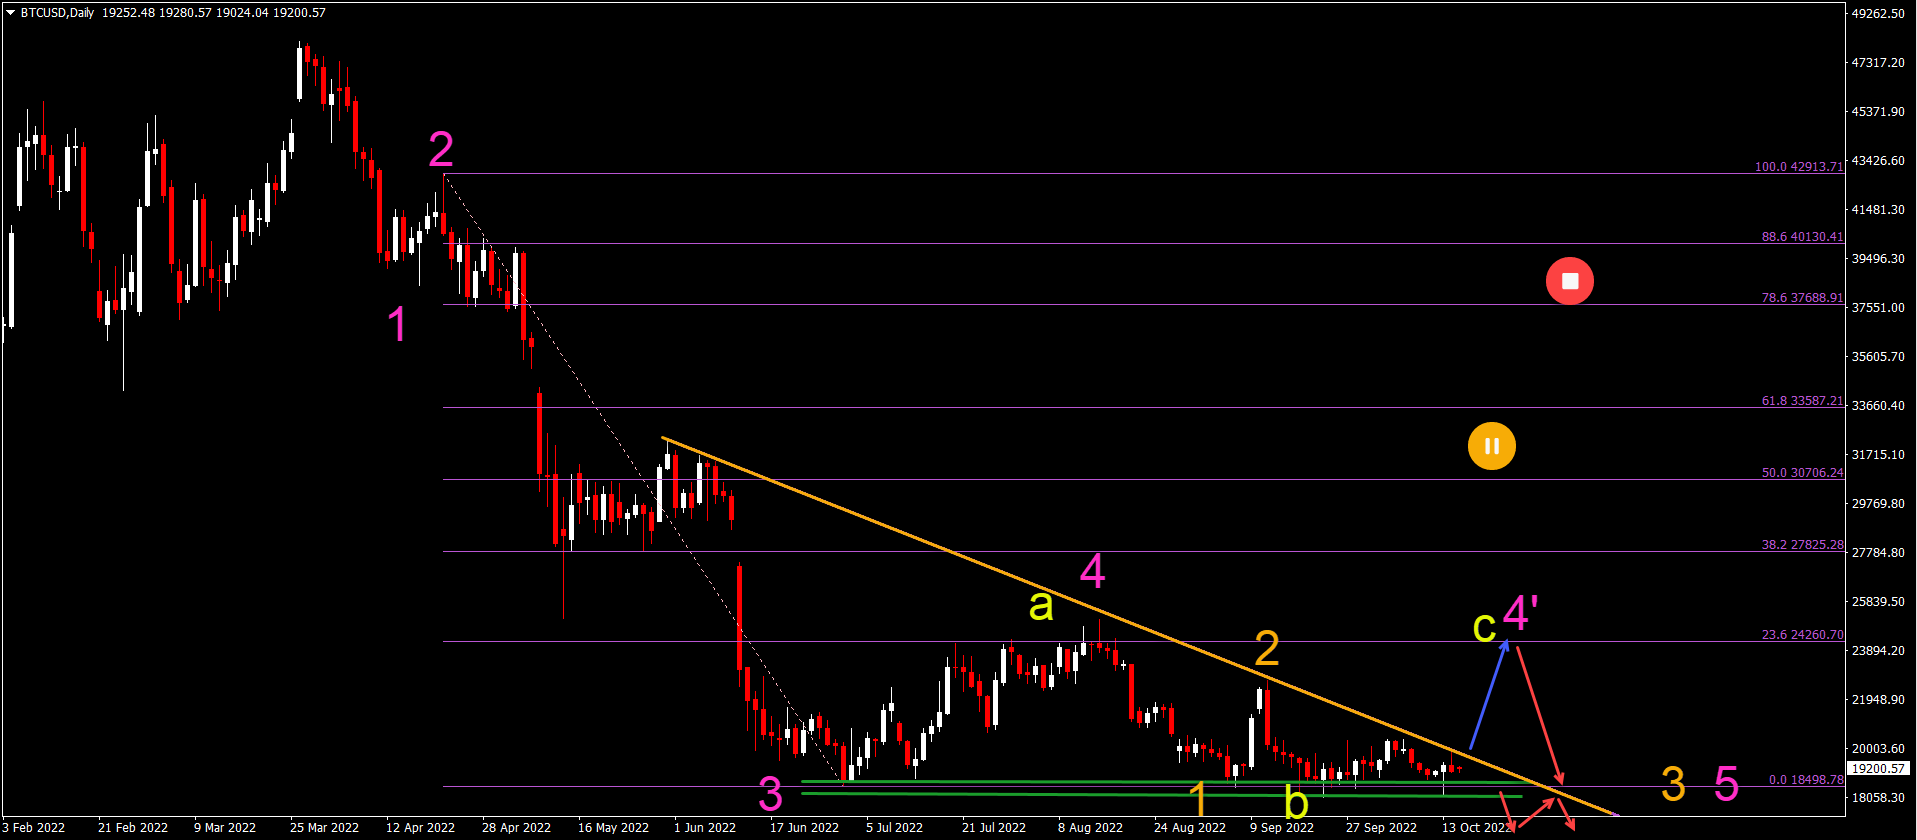
Bitcoin (BTC/USD) builds a descending wedge chart pattern, which usually breaks bearishly:
-
BTC/USD has tested the support zone (green) several times.
-
So far, BTC/USD failed to break below the support levels.
-
But the price action was barely able to move up because it faced strong resistance with every bullish attempt.
-
The flat bottom but descending resistance line indicates a descending wedge pattern.
-
A bullish breakout (blue arrow) may indicate an ABC (yellow) within wave 4′ (pink).
-
A bearish breakout (red arrows) indicates an immediate downtrend within wave 3 (orange) of wave 5 (pink).
-
The bearish targets are at $15k and $12.5k.
Natural gas bearish bounce at 50% fib resistance
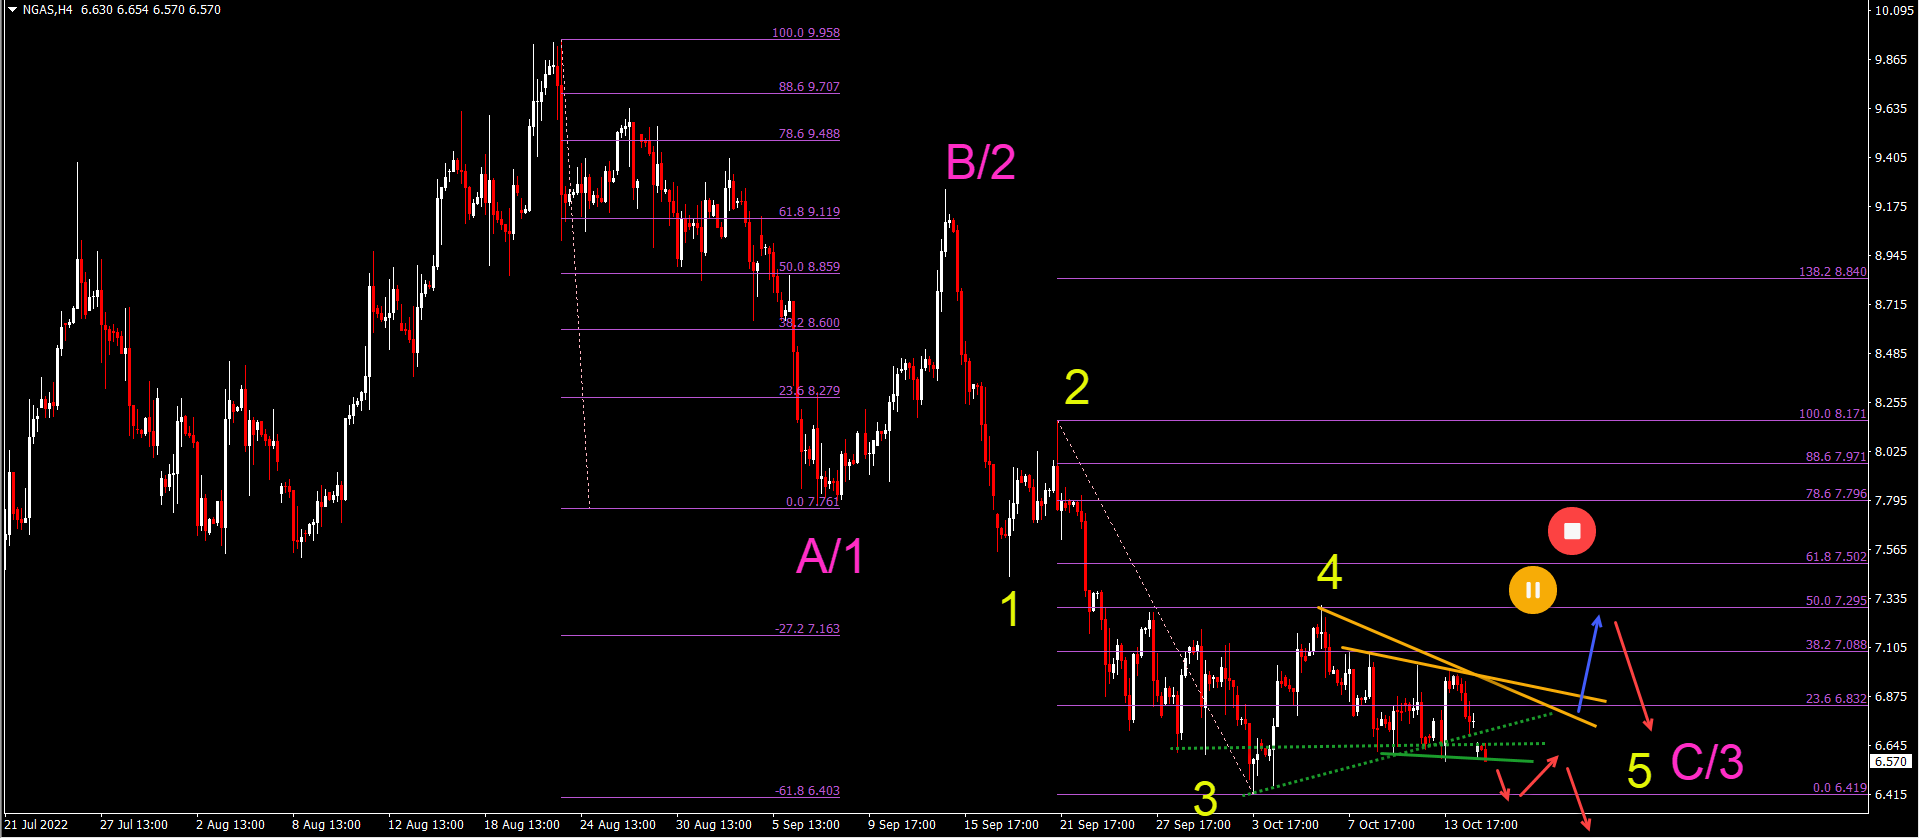
NGAS made a bearish bounce at the 50% Fibonacci level, which is likely a wave 4 (yellow):
-
The bearish bounce may indicate a 5-wave (yellow) pattern within a wave C or wave 3 (pink).
-
A bearish breakout (red arrows) may occur below the last remaining support line (green).
-
The main targets are $6, $5.50, $5.30 and $5.
-
A break below $5 increases the chance that the price action is in a bearish wave 3 (pink) rather than a wave C (pink).
-
A bullish breakout (blue arrow) above resistance (orange) may indicate an extended wave 4.
-
A break above the 50% Fib puts the bearish Elliott Wave analysis on hold.
The analysis is done with the indicators and template from the SWAT method simple wave analysis and trading. For more daily technical and wave analysis and updates, sign up to our newsletter


