Weekly Waves: EUR/USD, XAU/USD and Bitcoin
-
The EUR/USD break below the support zone (dotted green), which indicated a larger bearish move rather than a bullish correction.
-
BTC/USD (Bitcoin) faces three different scenarios, which are indicated by s1, s2 and s3 (green).
-
Gold (XAU/USD) has made a strong bullish bounce (reversal?) at the 50% Fibonacci retracement level.
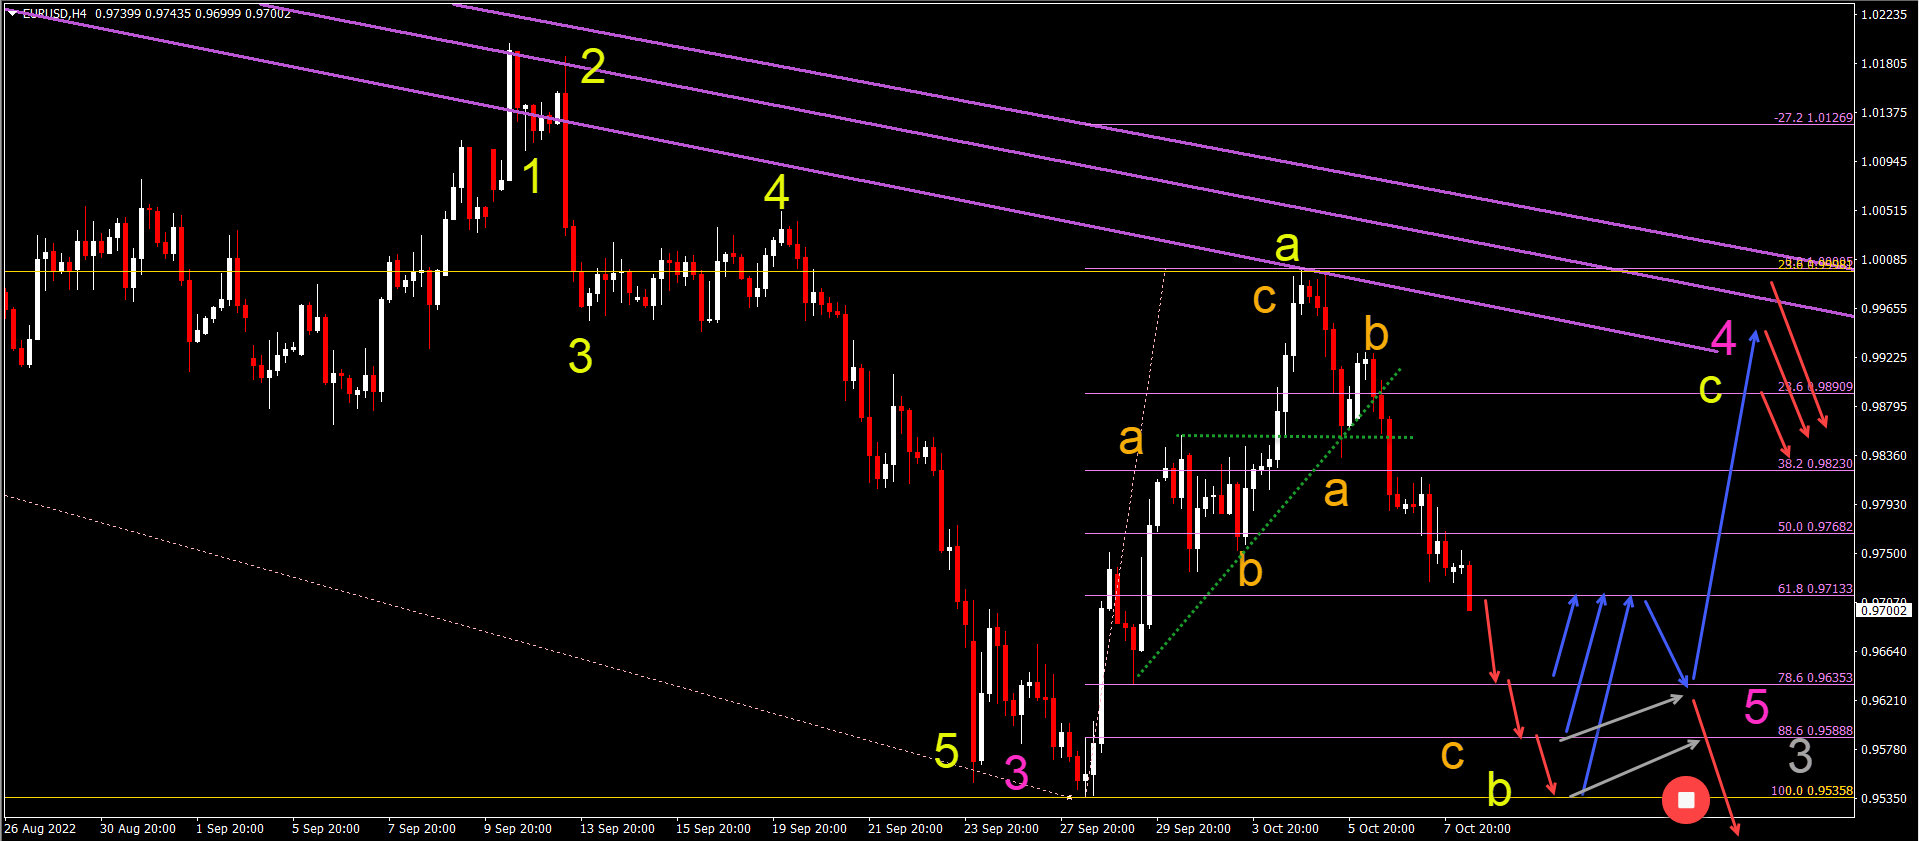
EUR/USD bearish decline in ABC pattern
The EUR/USD break below the support zone (dotted green), which indicated a larger bearish move rather than a bullish correction:
-
EUR/USD is likely to build a bearish ABC (orange) pattern.
-
ABC (orange) should complete a wave B (yellow) of a larger ABC (yellow).
-
The ABC pattern (yellow) can complete a wave 4 (pink).
-
Price action may fall towards the deeper Fibonacci levels or the previous low.
-
A bullish bounce could retest the resistance lines (purple) and the 23.6% Fibonacci level.
-
A bearish flag pattern (gray lines) followed by a bearish break invalidates the bullish ABC and indicates an immediate downtrend.
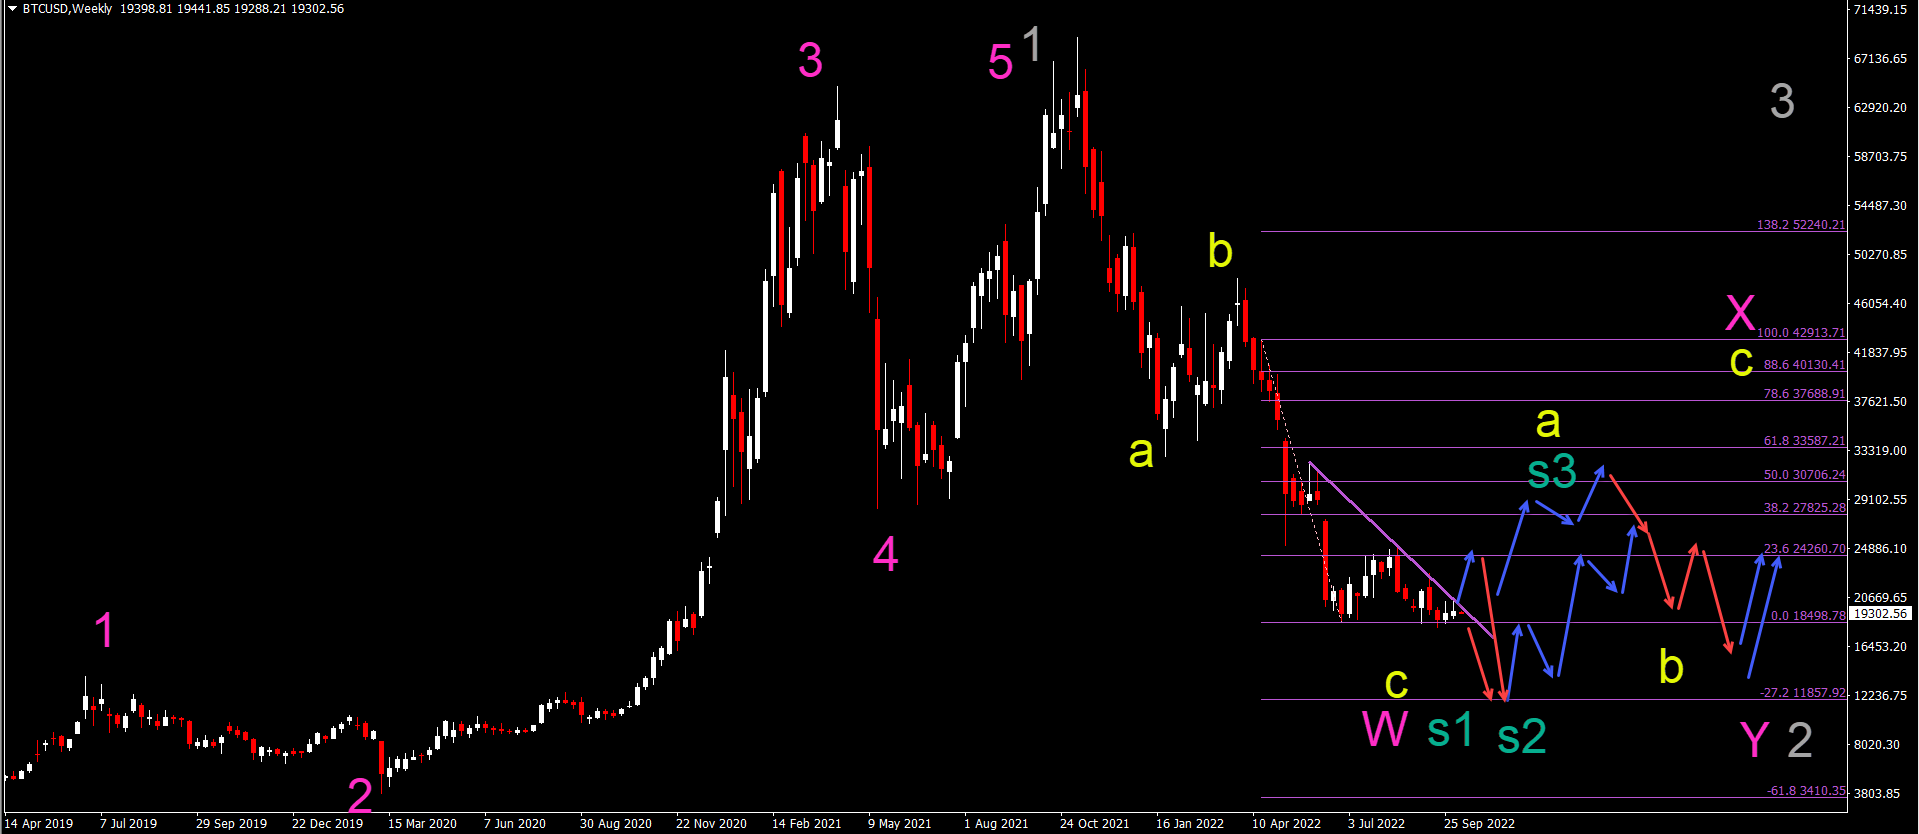
Bitcoin tests solid and key support
BTC/USD (Bitcoin) faces three different scenarios, which are indicated by s1, s2 and s3 (green):
-
The first scenario (s1 green) indicates an immediate bearish breakout towards the -27.2% Fibonacci target.
-
The second scenario (s2 green) indicates a retest of the resistance and then a bounce towards the same Fib target. Both s1 and s2 are part of wave C (yellow)
-
The third scenario (s3 green) indicates a major bullish retracement within a wave A (yellow) of a major wave X (pink).
-
Finally, wave C (yellow) should complete a wave W (pink).
-
A larger WXY (pink) correction is expected within wave 2 (grey).
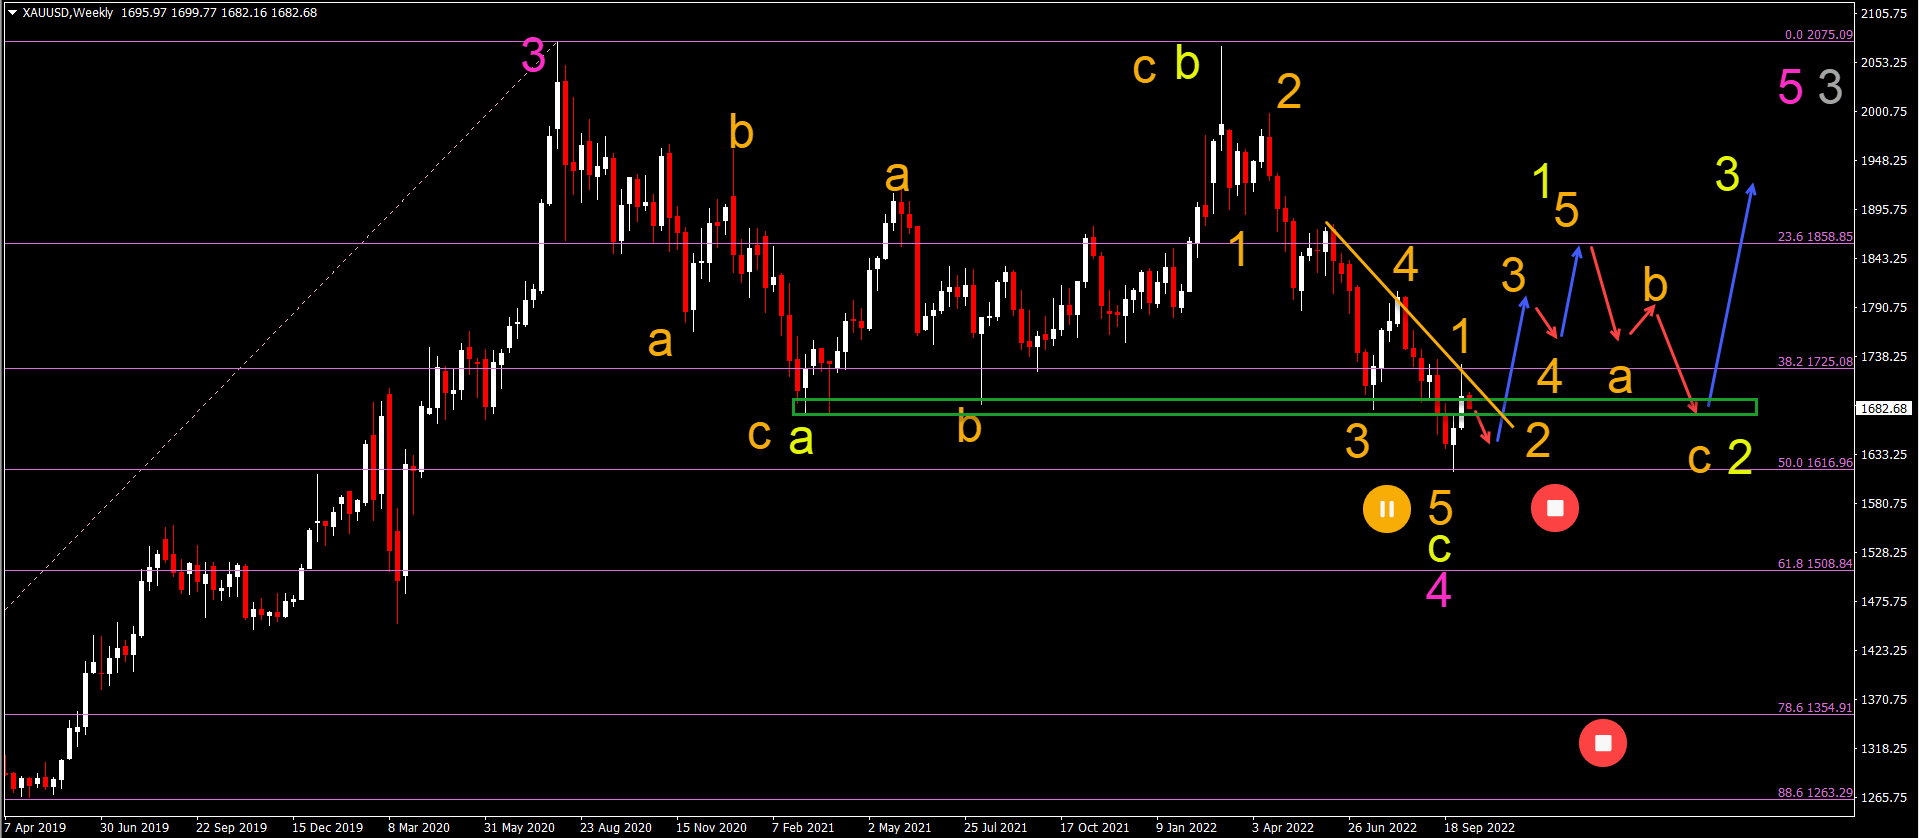
XAU/USD bullish bounce or reversal at 50% fibonacci
Gold (XAU/USD) has made a strong bullish bounce (reversal?) at the 50% Fibonacci retracement level:
-
The gold bounce at 50% Fib may confirm the end of wave 4 (pink).
-
A major wave 5 (orange) of a wave C (yellow) could have completed at 50% Fib.
-
The strong bullish bounce can be a wave 1-2 (orange) of a larger wave 1 (yellow).
-
This bullish reversal can remain valid as long as the price action remains above the bottom of the 50% Fibonacci level.
The analysis is done with indicators and a template from the SWAT method simple wave analysis and trading. For more daily technical and wave analysis and updates, sign up to our newsletter


