This Bitcoin calculation suggests that selling pressure may reach exhaustion

On-chain data shows that Bitcoin binary CDD has declined recently, a sign that selling pressure may be exhausting in the market.
Bitcoin 21-day MA Binary CDD has observed downward trend lately
As pointed out by an analyst in a CryptoQuant post, there was some heavy distribution going on in the market just a while ago. The relevant indicator here is “Coin Days Destroyed” (CDD). A coin day is the amount that 1 BTC accumulates after sitting idle at a single address for 1 day.
When a coin that was previously dormant (and thus had some coin days) moves slightly on the chain, the coin days counter is reset to zero, and the coin days it had accumulated are said to be “broken.” The CDD metric measures the total number of such coin days destroyed across the network on a given day.
When this indicator has a large value, it means that long-term owners are possibly moving or selling their coins, as this group tends to accumulate a large number of coin days. “Binary CDD,” the version of the metric used here, tells us whether the supply-adjusted CDD is more or less than the average supply-adjusted CDD.
Related Reading: Bitcoin Bottom or More Pain? Here’s what BitMEX founder Arthur Hayes thinks
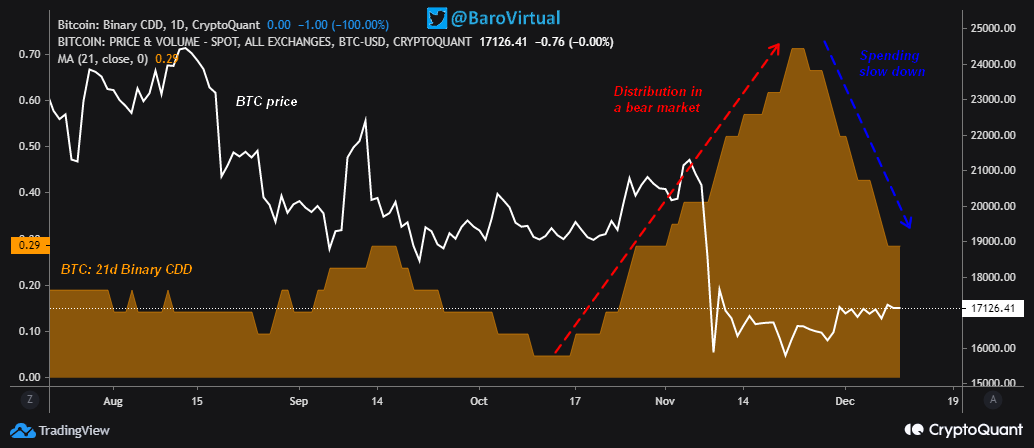
As the name already implies, this indicator can only have two values, 0 and 1. It is 0 when Bitcoin CDD is less than the average, while it is 1 when it is more. Here’s a chart showing the trend in the 21-day moving average for this metric over the past few months:

Looks like the 21-day MA value of the metric has been on the way down in recent days | Source: CryptoQuant
As you can see in the graph above, the 21-day MA Bitcoin Binary CDD had climbed up between mid-October and late November, suggesting that the long-term owners were dumping. BTC price took a big hit while this trend was taking place. In the last couple of weeks, however, the indicator has declined rapidly instead.
This could be a sign that the selling pressure that was previously present in the BTC market is now being exhausted, which could pave the way for a bottom formation in the price.
BTC price
At the time of writing, Bitcoin’s price is hovering around $17k, down 1% in the last week. Over the past month, the crypto has increased 1% in value.
Below is a chart showing the trend in the price of the coin over the last five days.

The value of the crypto seems to have dipped down in the last twenty-four hours | Source: BTCUSD on TradingView


