The Wyckoff method says that the Bitcoin (BTC) price has already bottomed

In today’s analysis, BeInCrypto looks at the Wyckoff chart, which can explain the current accumulation phase of the Bitcoin (BTC) price. This pattern, known from traditional markets, has already been used to correctly identify the top of the cryptocurrency bull market in 2021.
However, if Wyckoff accumulation is to play out according to its fundamental pattern, Bitcoin should not fall below the November low of $15,476. Moreover, in the near future, the largest cryptocurrency needs to reclaim support at $18,000 and then move towards $22,500.
What do Wyckoff forms mean?
Richard Wyckoff (1873-1934) proposed his classic analytical pattern. He was one of the pioneers of modern technical analysis, founder of the Magazine of Wall Street and a trader in traditional stock markets. It was in the analysis of these markets that the chart became popular.
The structure of a typical Wyckoff pattern consists of a series of sharp up and down price movements that form a kind of extended distribution or accumulation. This pattern often occurs after long-term declines or increases in a given asset. One of the tops or bottoms of the pattern is the top or bottom of the selected period of price action. Once reached, the trend reverses and the decline or rise accelerates.
To make good use of the Wyckoff form, one must first recognize it correctly. For this, trading ranges, the volatility of the asset and trading volume are used. Based on this, appropriate buying or selling decisions are made. The main principle here is gradual selling in the distribution period and gradual buying in the accumulation period. Roughly speaking, the two periods are mirror images of each other.
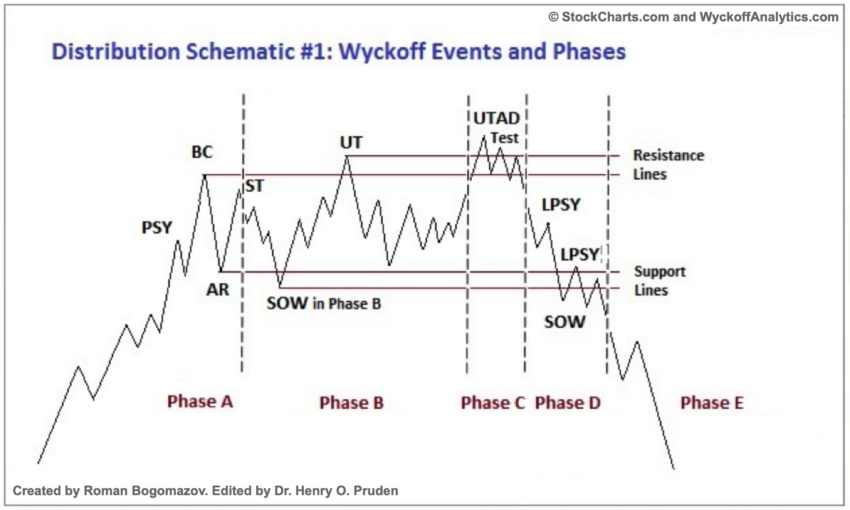
Distribution is a sideways market trend that takes place after a long uptrend. It is a phase where smart traders and large institutional players try to sell their positions without pushing the price down too much.

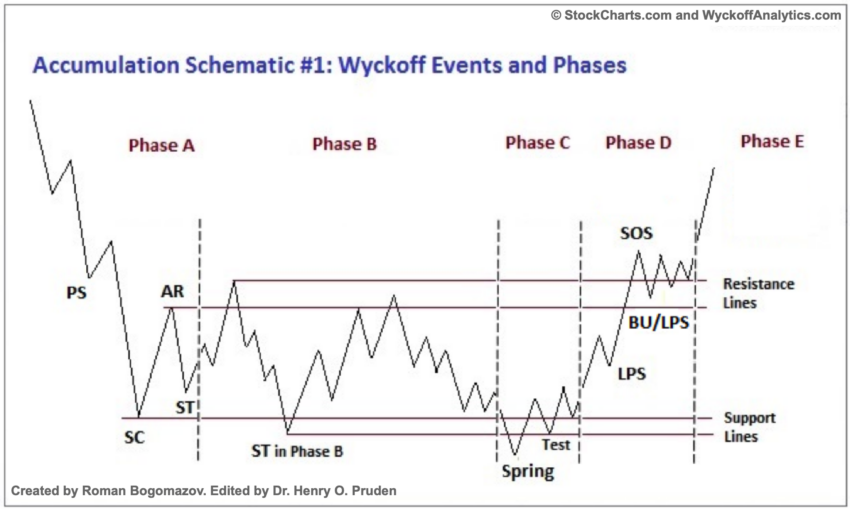
Accumulation is the exact opposite of distribution. Accumulation is a sideways market trend that occurs after an extended downtrend. It is a phase where smart traders and large institutional players try to buy positions without moving the price up too much.

Wyckoff accumulation in 6 phases
The Wyckoff chart provides detailed guidance for identifying periods of accumulation and distribution. These can be determined based on certain patterns that appear within these area-bound trends. In this way, the entire scheme can be divided into six phases. While analogous for both periods below, we present how Wyckoff accumulation proceeds:
1. Provisional support (PS)
A provisional support is a level that forms after a significant fall in market prices. Institutions and traders try to take long positions after a sharp decline. It will be difficult for the market to fall below this level due to strong buying pressure.
2 Selling Climax (SC)
A selling climax is characterized by a sharp decline below the original support. Panic selling is absorbed by large institutional players or smart traders. It often goes hand in hand with R&D and negative market news.
3 automatic rally (AR)
An automatic rally is an upward movement that occurs after a selling climax is reached. Prices rise, then fall rapidly after reaching a local peak. The highest point of these increases often coincides with the level of initial support (1), which now acts as resistance. After this phase, trading activity slows down and bearish sentiment weakens.
4 secondary test (ST)
A secondary test takes place after an automatic rally. It indicates that the price of an asset has reached a market bottom. It is common for several secondary tests to occur as the market tests the strength of buyers.
A spring into life
5 Spring
A spring is a strong and definitive shock that often occurs in the accumulation phase. Prices will often fall below SC and ST levels. The loss of the trading area is short-lived. Price bounces back quickly to confirm a false breakout. Large players mislead dealers, and into buying assets at a lower price. Wyckoff accumulation is confirmed in this phase.
6 Signs of Strength (SOS)
A signal of strength takes place after the spring and indicates the return of bullish sentiment to the market. In this phase, the price recovers the area of the first support of the entire Wyckoff accumulation. Sometimes the recovery is initiated by the Last Point of Support (LPS) phase, which is a retest of previous resistance. The sign of the strength phase confirms the advantage of buyers and the start of an upward trend.
Wyckoff accumulation on the Bitcoin chart
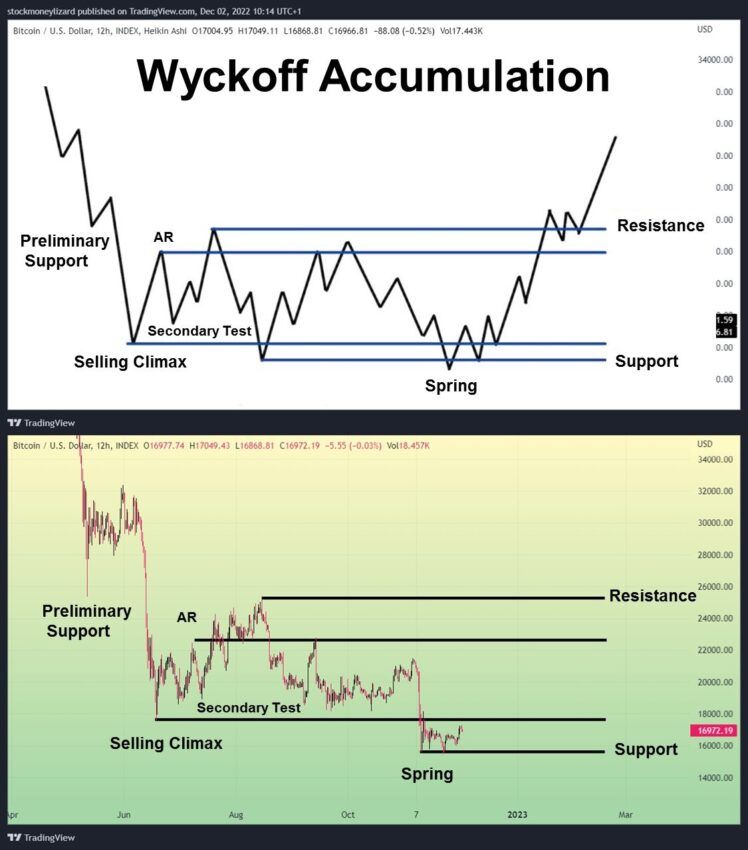
Popular cryptocurrency market analyst @StockmoneyL recently suggested that Bitcoin may currently be pursuing successive phases of Wyckoff accumulation. IN his tweethe compares the daily BTC price from mid-May 2022 to now with the Wyckoff pattern.

According to this comparison, Bitcoin has already gone through the first four phases of Wyckoff accumulation and experienced a selling climax (SC) in the $18,000 area. Currently, it is in the 5th phase and at the same time at the lowest point of accumulation, the spring phase.
If this is indeed the case, BTC price should no longer fall below the $15,476 low on November 21st. Also, it should quickly regain the SC area and confirm it as support. We can conclude that the current phase (spring) was just a false breakout and the price managed to return to the accumulation area.
Going forward, the BTC price will have to try to regain the $22,500 area – the top of the AR phase reached in July and retested in mid-September. On the other hand, the final confirmation of the end of the Wyckoff accumulation will be the recovery of the PS level near $26,000, which is the May low resistance.
A Bitcoin drop below the current low of $15,476 will lead to the rejection of this version of Wyckoff accumulation. Likewise, a too long stay of the BTC price below the $18,000 level will also falsify this pattern.
For BeInCrypto’s latest crypto market analysis, click here.
Disclaimer
BeinCrypto strives to provide accurate and up-to-date information, but it will not be responsible for missing facts or inaccurate information. You comply and understand that you should use this information at your own risk. Cryptocurrencies are highly volatile financial assets, so do your research and make your own financial decisions.


