Dormant supply on the go again
On-chain data shows that some dormant Bitcoin supply is once again moving into exchanges, which could be bearish for the price of the crypto.
Bitcoin exchange supply for old coins has observed peaks in recent days
As pointed out by an analyst in a CryptoQuant post, some coins in the 2y-3y and 3y-5y age groups have recently been deposited into exchanges.
The “Exchange inflow” is an indicator that measures the total amount of Bitcoin transferred to the wallets of all centralized exchanges.
When the value of this metric is high, it means that investors are depositing large amounts of money into exchanges right now. Such a trend, when prolonged, can prove bearish for the value of the crypto as it can be a sign of dumping by holders.
A modified version of this indicator is the exchange supply “Spent Output Age Bands” (SOAB), which tells us about the individual contribution to the total inflows from the various supply groups in the market.
These cohorts are categorized based on how long their coins have been idle. The relevant age groups here are “2y-3y” and “3y-5y”; the chart below shows the trend in currency supply coming from these supplies:
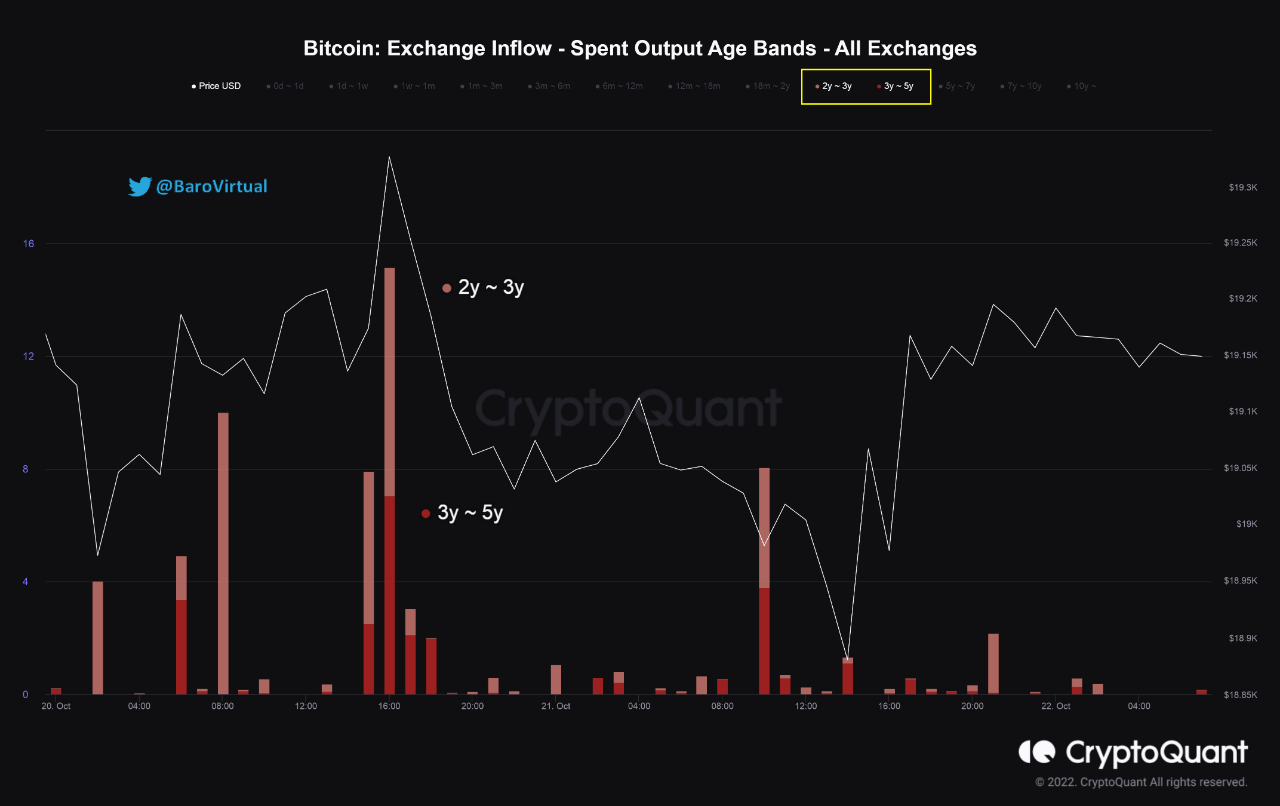
Looks like the value of the metric for these cohorts has been raised in recent days | Source: CryptoQuant
As you can see in the graph above, Bitcoin exchange SOAB inflows have increased for these coin groups over the past couple of days or so.
This means that some investors have deposited large amounts of coins aged 2 to 3 years and those between 3 and 5 years.
Such old supply is called “long-term holding” supply. Generally, the older the coins are, the less likely they are to move at any given time.
So any movement from these coins, especially those to exchanges, can have noticeable implications on the price of Bitcoin.
BTC price
At the time of writing, Bitcoin’s price is hovering around $19.1k, up 1% in the last seven days. Over the past month, the crypto has lost 1% in value.
The chart below shows the trend in the price of the coin over the last five days.

The value of the crypto seems to have rebounded back from the dip a couple of days ago | Source: BTCUSD on TradingView
Bitcoin has continued to show choppy price movement over the past week as the crypto has mostly stayed around the $19k level. Two days ago, BTC made an attempt to break the monotony by plunging down to $18.7k, but it didn’t take long for the coin to be back at $19k.
Featured image from Max Saeling on Unsplash.com, charts from TradingView.com, CryptoQuant.com


