Cryptos bounce as CEO of FTX promises to do right by investors
- Bitcoin price breakout retraces 14% after falling to 2020 levels on Wednesday, November 9
- Ethereum price is up 20% after its free fall earlier in the week
- The XRP price shows that bears may be in control of the trend in the coming weeks.
The crypto market is showing appreciable signs of retaliation after the landslide decline witnessed earlier this week. Like many in the space attribute, the liquidation of FTX’s dubious risk-on policies, FTX CEO Sam Bankmanfreid has vowed to restore investor confidence. Still, since nothing in Crypto is ever a guarantee, investors should consider using sound risk management practices in this highly unpredictable market.\
Bitcoin price bounces back
Bitcoin price is currently trading at $17,271. After a 25% decline on the week, the peer-to-peer digital currency posted a 14% countertrend rally. The most important thing to note about Bitcoin’s recent price performance is the previous decline that broke oversold levels on the Relative Strength Index on almost every time frame except the monthly one.
Bitcoin’s monthly RSI is hovering just above the final support level. Essentially, if Bitcoin’s monthly close settles any lower on the RSI, the future of Crypto will be in serious jeopardy. The Volume Profile indicator shows the current decline as the smallest number of transactions since 2021. Despite the devastating selloff, the indicator suggests that a market bottom is near.
The monthly chart is likely to determine whether the market has the potential for a long-term bullish trend. For this reason, you may want to use a sound risk management approach and consider zooming out and reviewing the macro count.
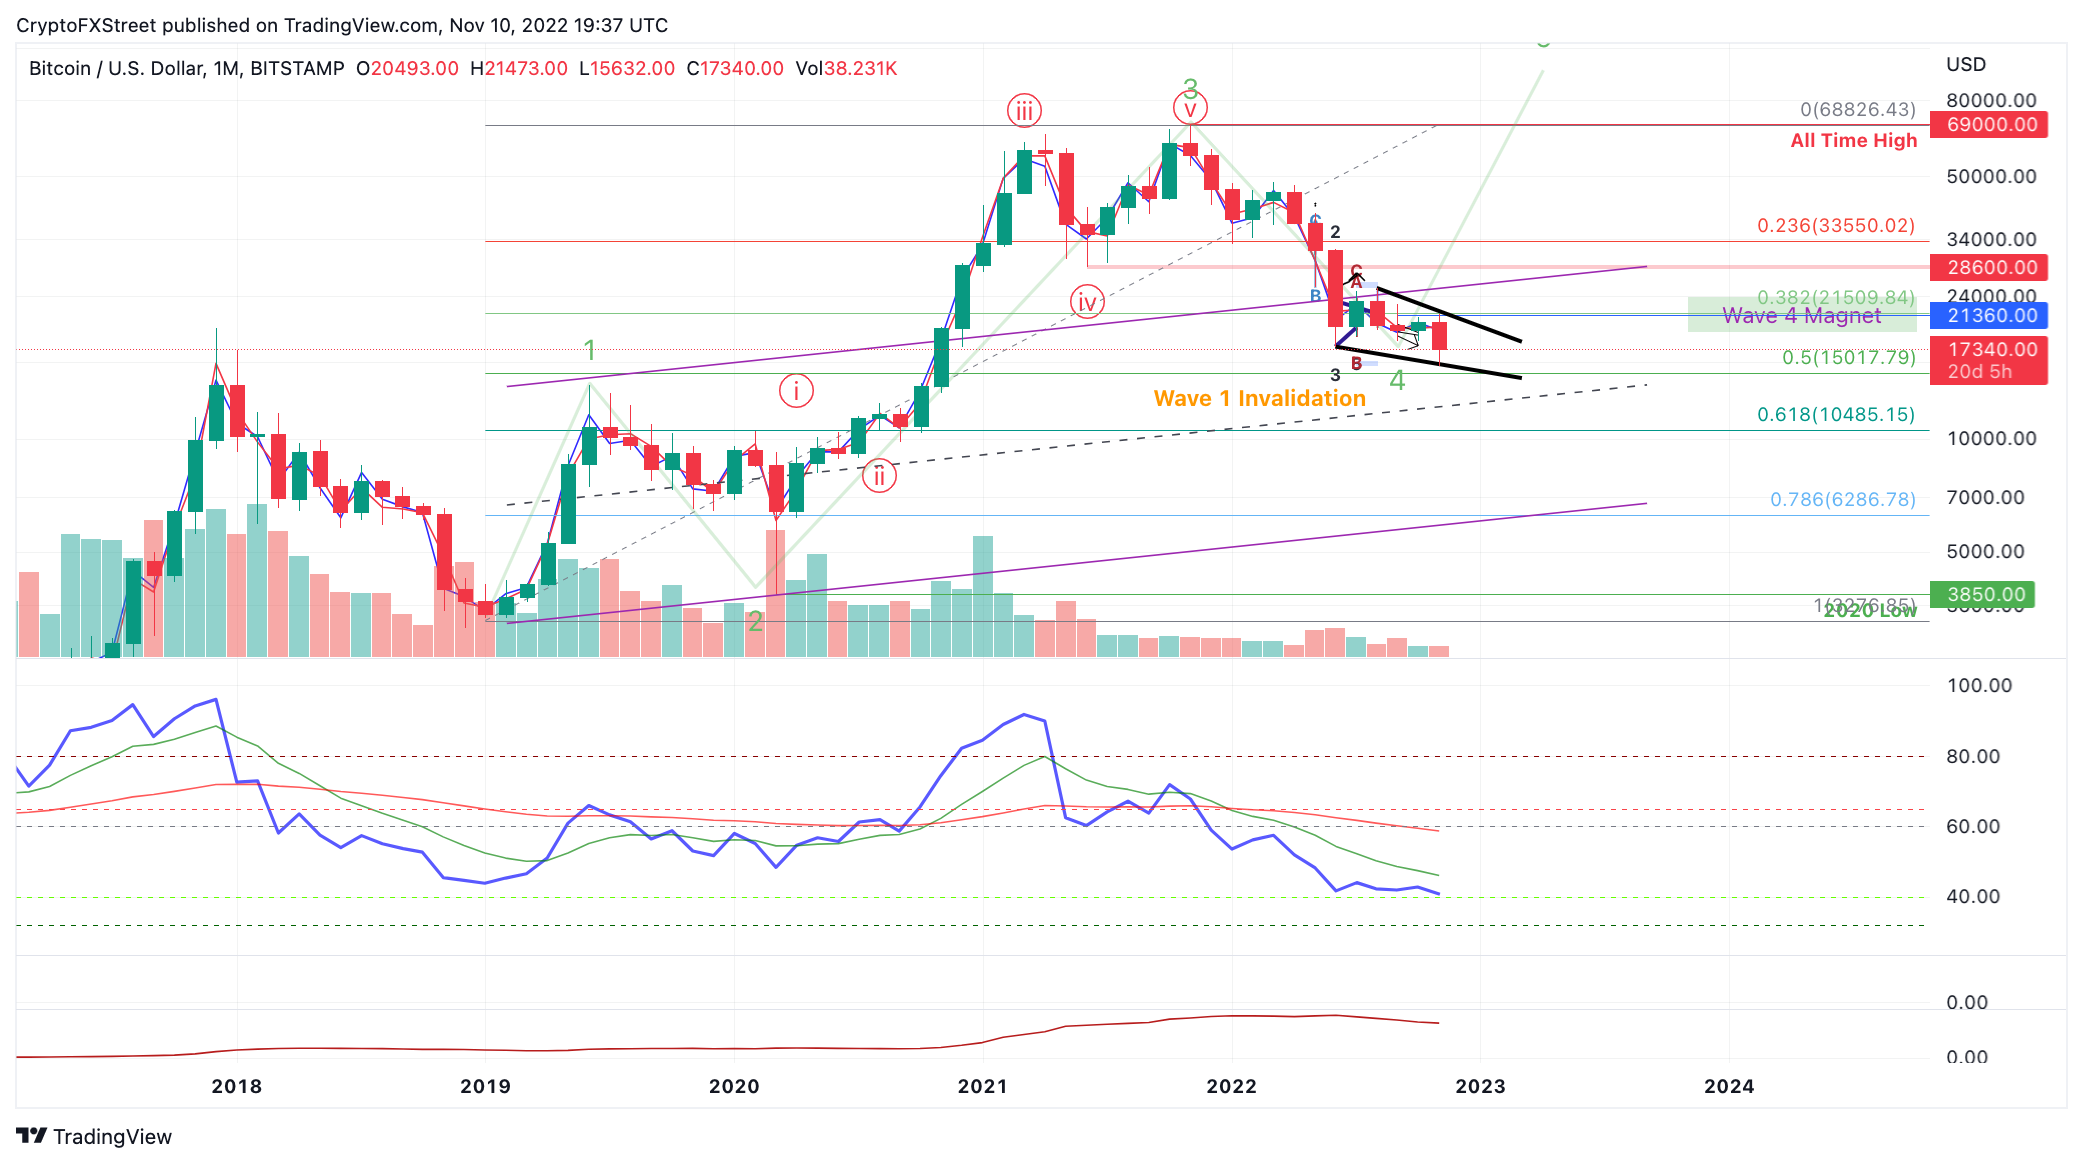
BTC/USDT !Monthly Chart
In the following video, our analysts dive deep into the price action of Bitcoin, analyzing key levels of interest in the market. -FXStreet Team
Ethereum price bounces back.
The Ethereum price has risen by 20% since the devastating liquidation that took place during the US mid-term elections earlier this week. Like Bitcoin, the smaller timeframes suggest that ETH is in full control of the bears. However, the monthly chart suggests otherwise. According to the technicals, ETH is still swinging within a range and the RSI is still within supportive terrain.
Ethereum price auctions at $1,288 as the price now consolidates just below the September monthly open of $1,350. This week’s market sentiment has witnessed an increase in pessimism as the leading crypto exchange giant, FTX, witnessed a 90% loss of market capitalization. The exchange was accused of irresponsible risk-on policies, which provoked its main competitor, Binance, to liquidate $2 billion worth of the FTX token. Amid the controversial sale, Bankman-Fried recently promised to restore the FTX token and crypto investors to normality.
Due to the highly volatile market, a very short-term scalp approach can be used by traders, while investors can still use the June 18 swing at $880 as an invalidation point for any uptrend potential. A countertrend rally toward $1,800 could still be achieved in the coming weeks based on the significant amount of low volume during the current selloff. If the $880 level has been breached, a decline to as low as $400 could occur as the first retest of the Elliott Wave trend channel surrounds Waves one and two between the December 2018 and March 2020 lows.
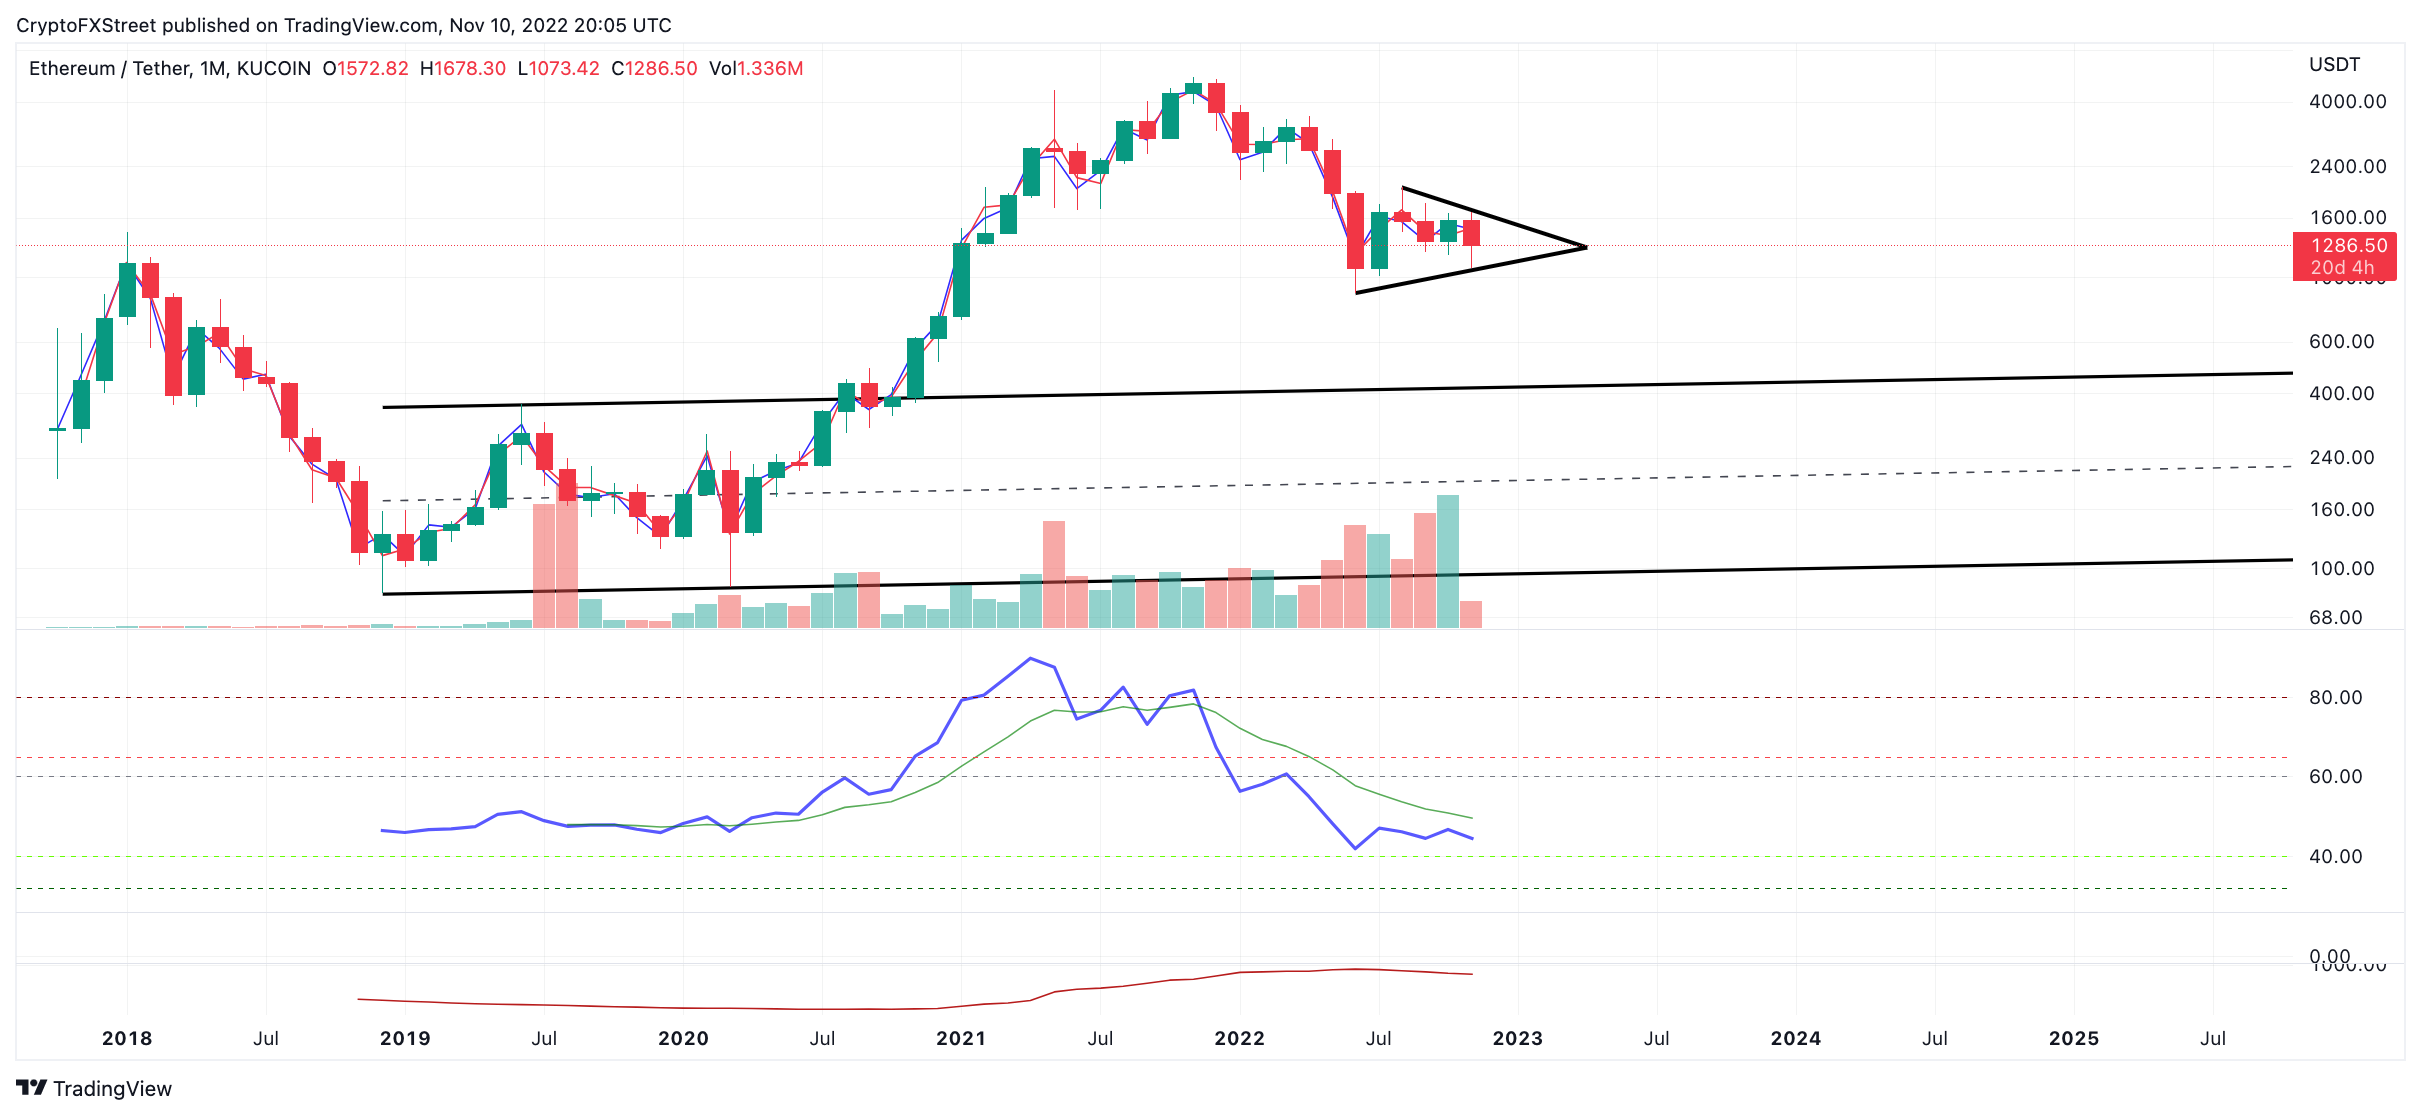
ETH/USDT 1-month chart
In the following video, our analysts dive deep into the price action of Ethereum, analyzing key levels of interest in the market. -FXStreet Team
The XRP price is showing strength
The XRP price rallied 22% on November 10 after undergoing a devastating crash similar to ETH and BTC. The bounce was catalyzed by a response to XRP’s first retest of the parallel channel median line since it broke through the barrier on September 19. While the bullish retaliation is an optimistic gesture for the digital transfer certificate, it is an important piece of evidence that suggests the XRP price may be at risk in the near term.
XRP price auctions at $0.386. The latest downtrend broke through the strongest bullish engulfing candle with a low of $0.34. Based on classic technical analysis, the bears’ ability to break the low suggests that they are in full control of the trend. For this reason, investors may be hesitant to get involved in the XRP price. On a weekly basis, the relative strength index failed to rally through bull run territory after weeks of climbing out of oversold territory. RSI conflates the idea that Ripple may be due to more pain.
If the market is genuinely bearish, a sweep, the bottom event could occur in the coming weeks with an eye on the summer low at $0.2872. Invalidation of the bearish thesis could occur if the bulls mark the weekly high at $0.48. If the breach occurs, the bulls could produce a countertrend rally to challenge the $0.55 swing high established in October. Such a move would result in a 40% increase from the current XRP price.
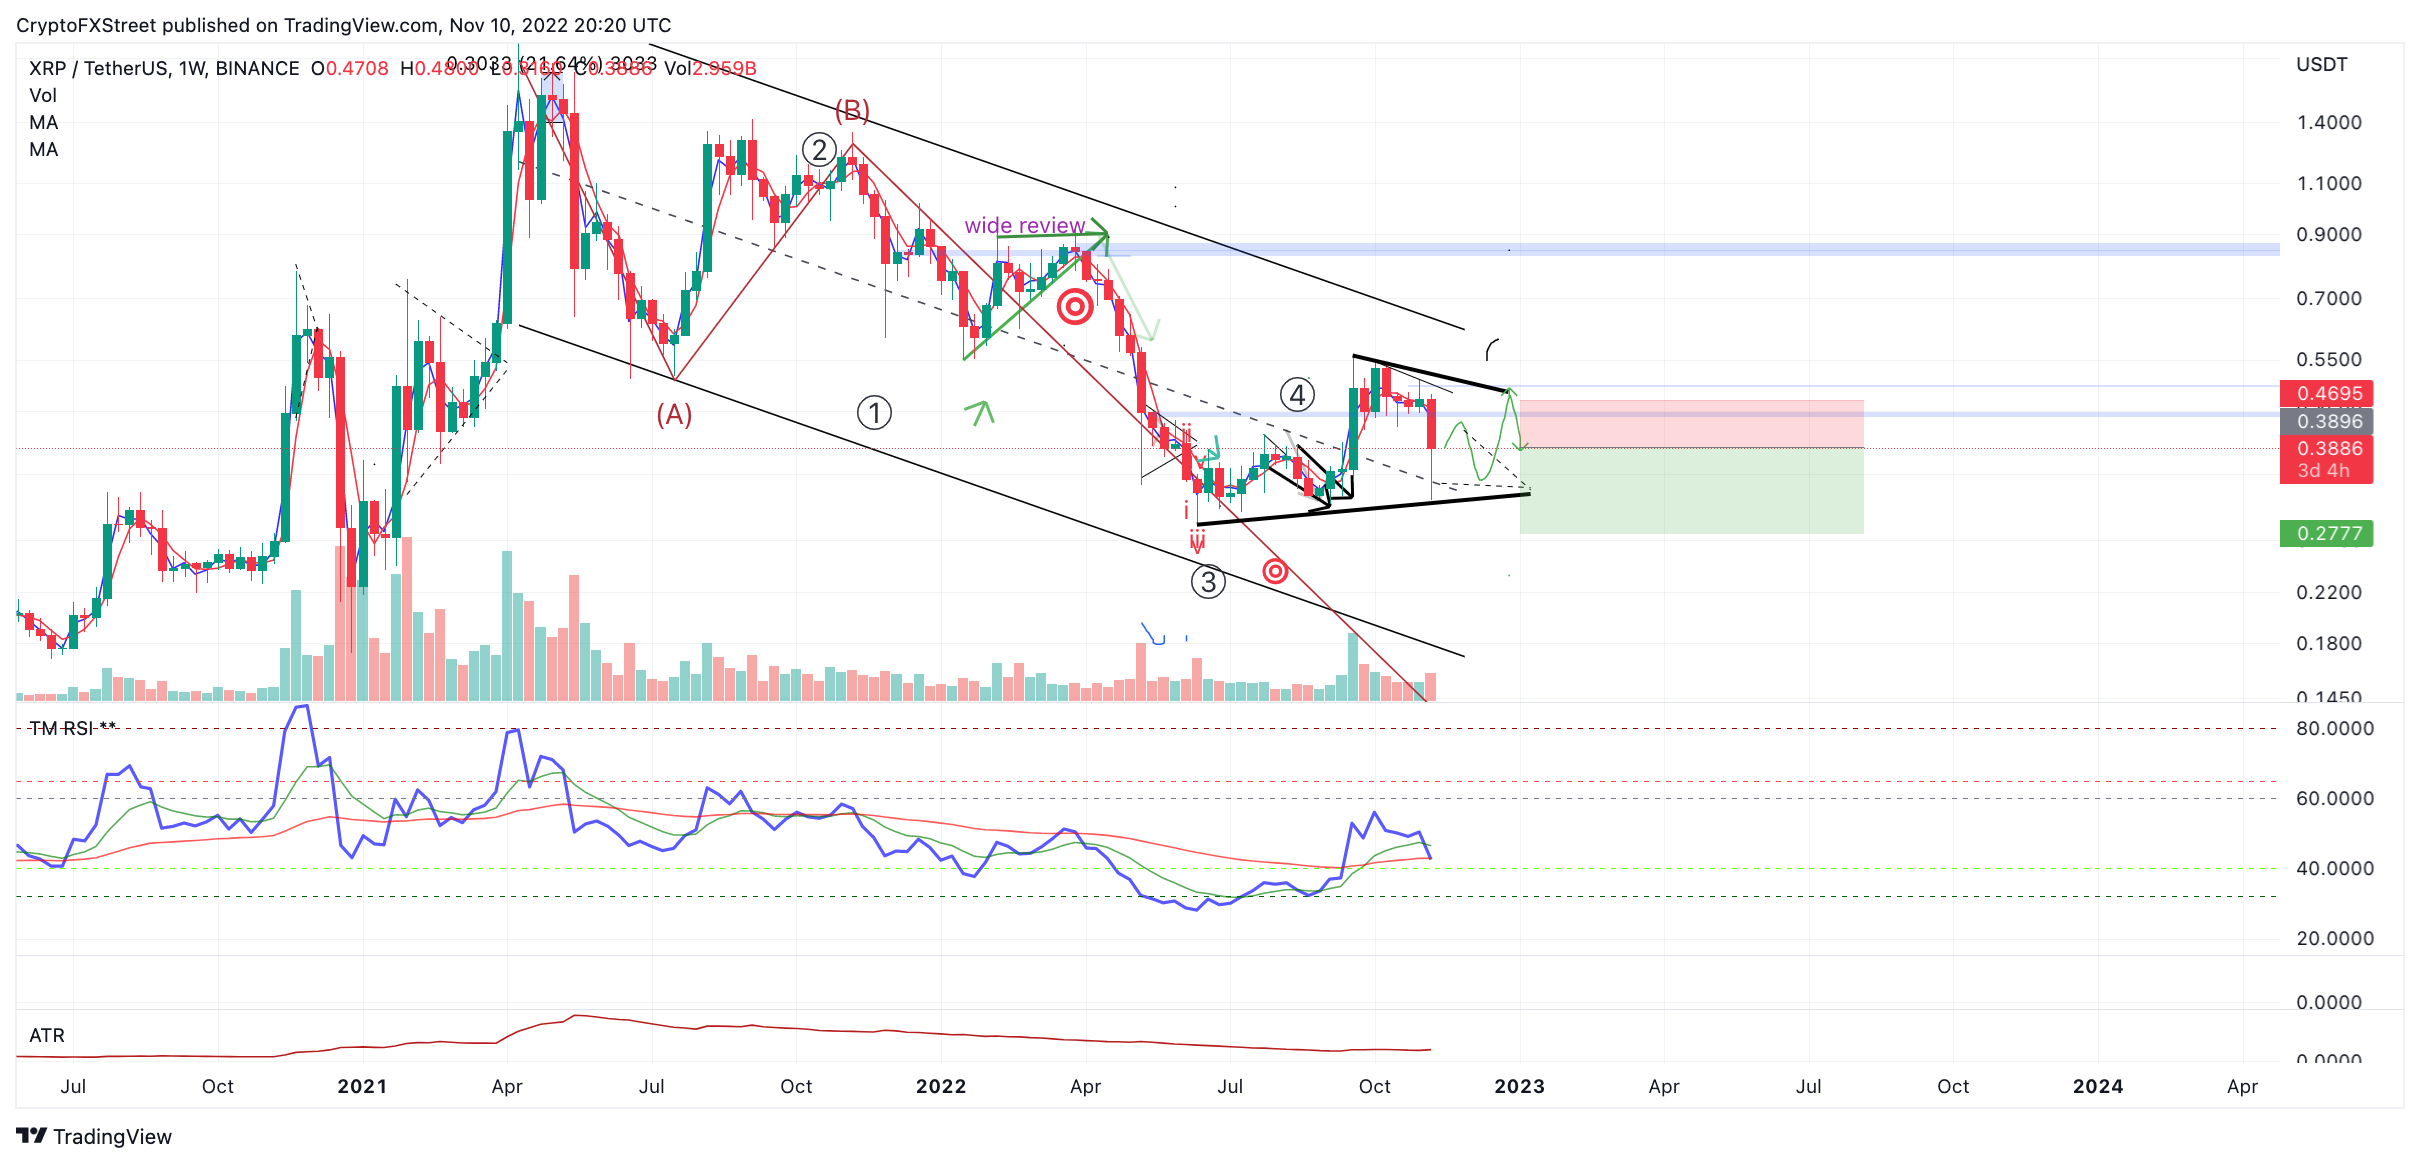
XRP/USD 1-week chart
In the following video, our analysts dive deep into the price action of Ripple, analyzing key levels of interest in the market. -FXStreet Team


