Bitcoin volatility dips to multi-year lows as chaotic 2022 quietly draws to a close
Data shows that Bitcoin’s realized volatility has plunged to multi-year lows this month, suggesting that the chaotic 2022 may look set to end on a calmer note.
Bitcoin short-term realized volatility is now the lowest since October 2020
According to the latest weekly report from Glassnode, BTC has been pretty quiet this December month, compared to what was a very chaotic rest of the year. The relevant indicator here is “annualized realized volatility”, which measures the standard deviation of daily returns from the Bitcoin market average.
When the value of this metric is high, it means that the price of the crypto has shown large daily fluctuations recently. Such values suggest that crypto currently involves high trading risk. On the other hand, low volatility values suggest that the BTC market has shown a rather stale price movement recently, with day-to-day returns quite low.
The indicator can be taken over a rolling window based on any time period, but in the context of the current topic, the most useful versions of the calculation are the 1-week, 2-week and monthly versions. Now, here’s a chart showing how the 7-day moving average annual realized volatility of Bitcoin has changed for these short-term windows over the past few years:
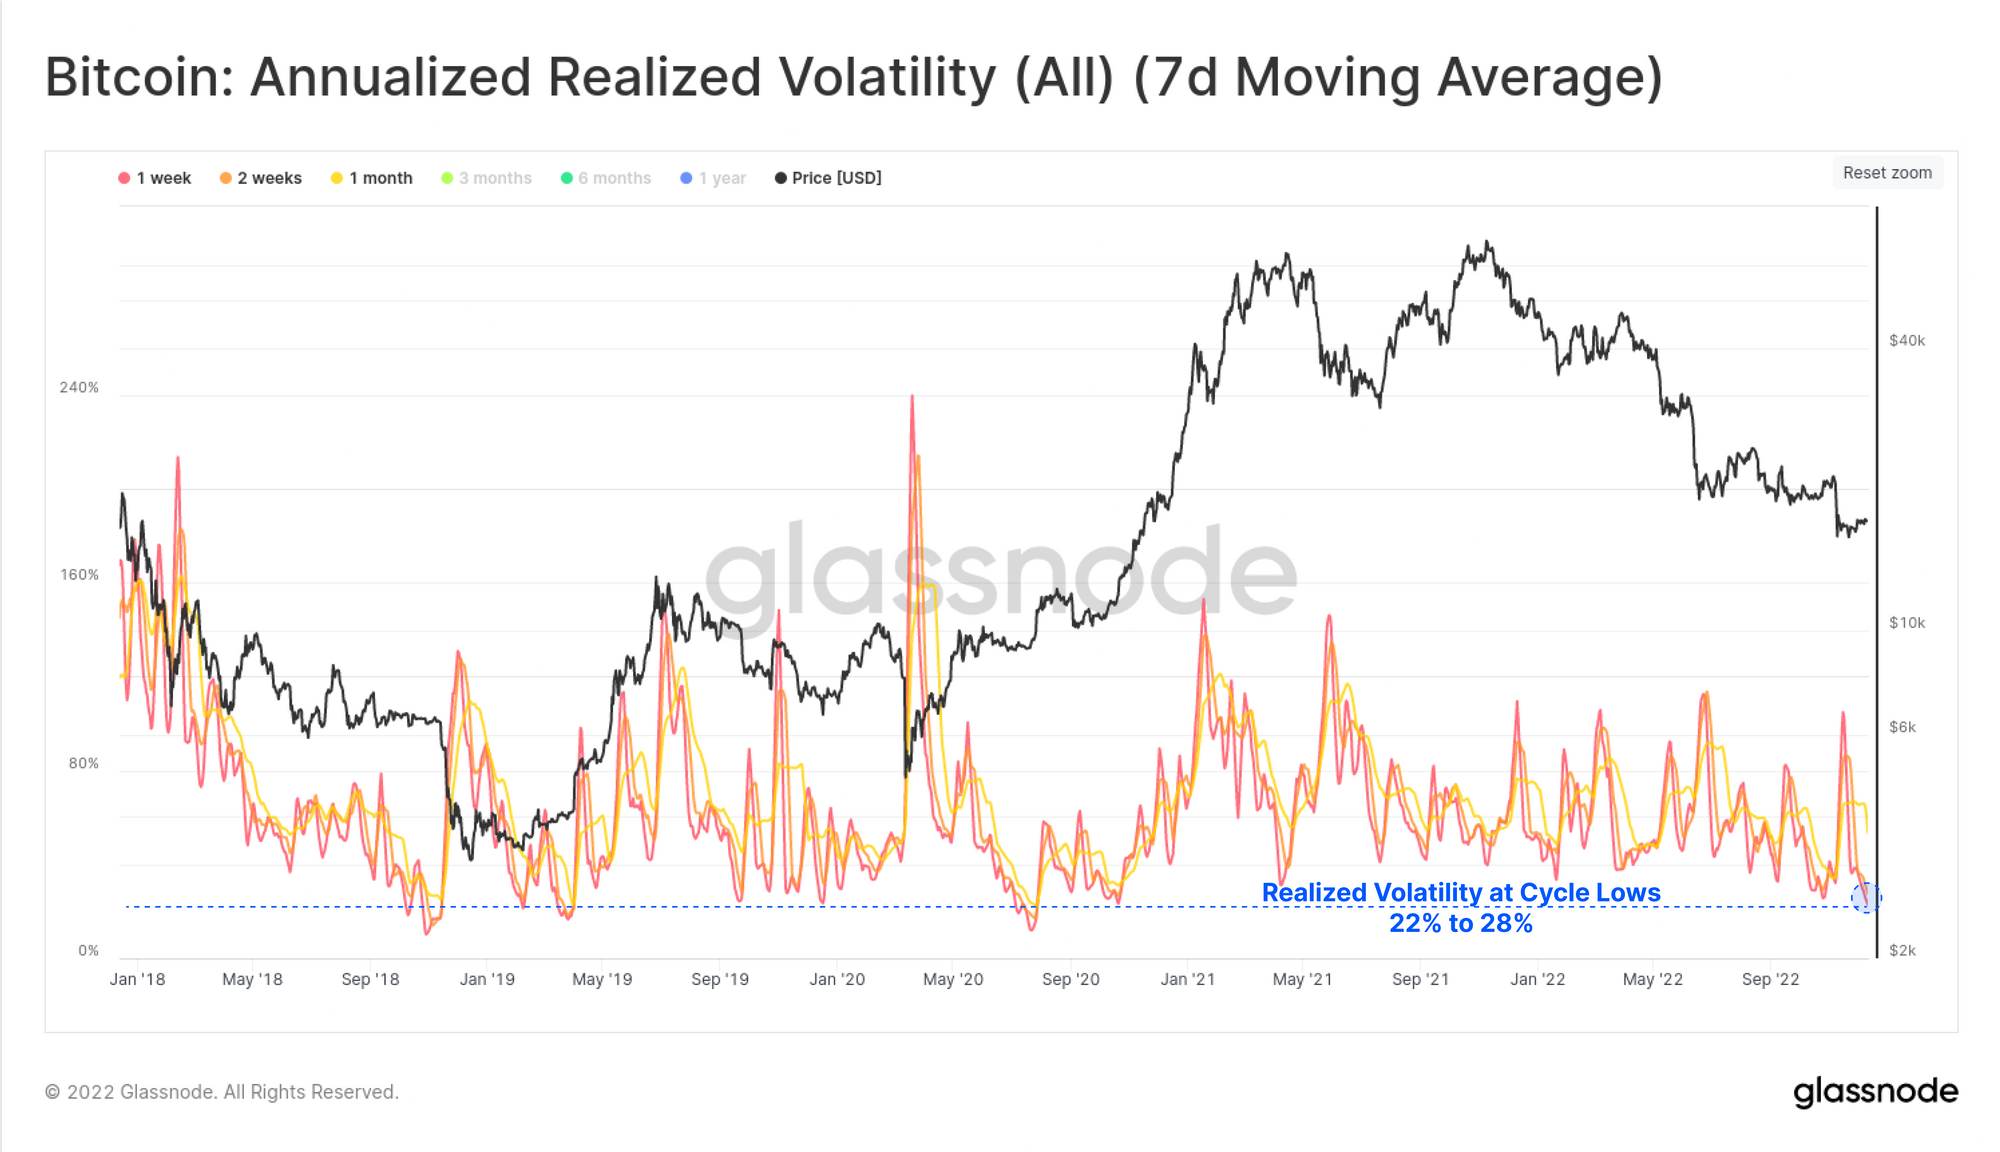
The 7-day MA values of these metrics seem to have gone down in recent days | Source: Glassnode's The Week Onchain - Week 50, 2022
As you can see in the graph above, the annual realized volatility for Bitcoin over these time periods has been at decently high levels for most of 2022. The year has been marked by several highly volatile events such as the Terra USD (UST) collapse, the 3AC bankruptcy and the subsequent domino effect on other lenders, and the latest FTX debacle which has also brought new contagion with it.
However, in this past month of December, short-term volatility appears to have taken a nosedive to cycle lows as the asset’s price has largely traded sideways. Now, 1-week annualized realized volatility is just 22%, while the 2-week version is down to just 28%. The last time Bitcoin saw such lows in these metrics was back in October 2020, before this cycle’s bull run began.

Looks like the value of the crypto has seen a sharp surge during the past 24 hours | Source: BTCUSD on TradingView
At the time of writing, Bitcoin’s price is hovering around $17.4k, up 2% in the last week. Over the past month, the asset’s investors have accumulated 3% in profits. The chart above shows the trend in the price of the coin over the last five days.


