Bitcoin price has more upside: fear and greed indices

The Crypto Fear and Greed Index points to persistent fear in the crypto market despite the recent rally. Bitcoin price traded at $17,870 on Wednesday, slightly higher than the year-to-date low of $15,520. BTC to GBP was trading at 14,370 while the BTC/EUR price was trading at 16,600.
What is the fear and greed index?
The financial market is mostly driven by fear and greed. When things are going well, investors tend to get greedy and buy more. We saw that clearly during the return of crypto and meme stocks in 2021.
On the other hand, investors tend to get scared when things don’t work out well. Therefore, the fear and greed index is a tool that gives an estimate of where things stand in relation to the two.
The most widely used index was created by CNN Money and is often used in the stock market. It looks at market sentiment by identifying the performance of key areas such as stock market breadth and strength, put and call options, market momentum and safe haven demand.
Read a review of the best Bitcoin exchanges.
The Bitcoin Fear and Greed Index aims to replicate this performance in the crypto market. It looks at market volatility, social media activity, dominance and Google trends. It varies between 0 (very fearful) and 100 (very greedy).
In some cases, experts recommend buying when it is in the fear zone and short when it becomes extremely overbought. This is based on a popular Warren Buffett quote: buy when everyone is scared and short when they are greedy.
However, based on performance, the Bitcoin price tends to do well when the fear and greed index is in the greed range and vice versa. This happens because it usually has momentum when investors are greedy.
Therefore, with the index at the fear area of 30, it means that it is making improvements since it was at 24 last month. This means that the coin may continue to rise for some time.
Bitcoin price prediction

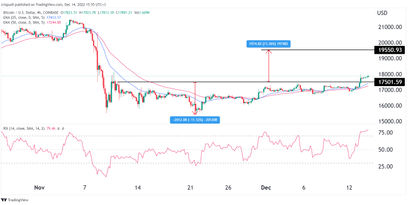
The 4H chart reveals that BTC price has been in a slow bullish comeback for the past few days. During this period, it has formed an inverted head and shoulders pattern, which is a bullish sign. The coin is also above the 25-day and 50-day moving averages while the RSI has moved to overbought levels.
Therefore, due to the H&S pattern, I suspect that Bitcoin will continue to rise as buyers target the key resistance at $19,550. This price is derived by measuring the distance between the head and shoulders


