Bitcoin Price Analysis: BTC Continues To Hover Around $17,000, Could $17,500 Be The Next Stop?

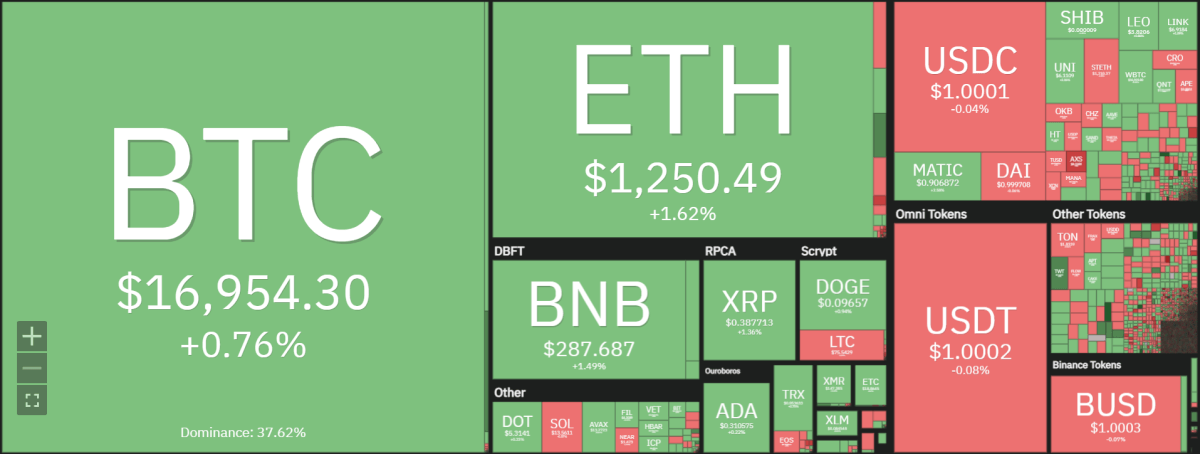
Recent Bitcoin price analysis indicates that the top coin continues to trade in a narrow range between $16,788.78 and $16,935.37, with potential upside resistance at $17,618.72, and potential downside support at $14,893.55. There was a short-lived bull run during November’s Bitcoin shutdown. high of $17,364.28 and it was then followed by a sell-off that sent the coin falling to lower levels.

With BTC currently hovering around $17,000, many analysts believe the coin may have bottomed out and a potential breakout upside could be around the corner. Some of Bitcoin’s market analysts have looked at past price patterns and believe that Bitcoin will do well in the next halving event. They say the value could go up more than 100 times, with a possibility of it reaching $100,000 or more by the spring of 2024.
The next time the block reward is halved, block 840K is set. This should take place sometime in the spring of 2024 and will see the current per block reward of 6.25 BTC drop to 3.125 BTC. This event could have a major effect on Bitcoin’s value.
As we can observe from historical data, Bitcoin’s spot price has increased by more than 1263% between halvings in 2016 and 2020. At this growth rate, many market analysts predict that Bitcoin could reach levels well above $100k by the spring of 2024.
Bitcoin Price Analysis: Bitcoin stagnates again, but a bullish breakout may be near
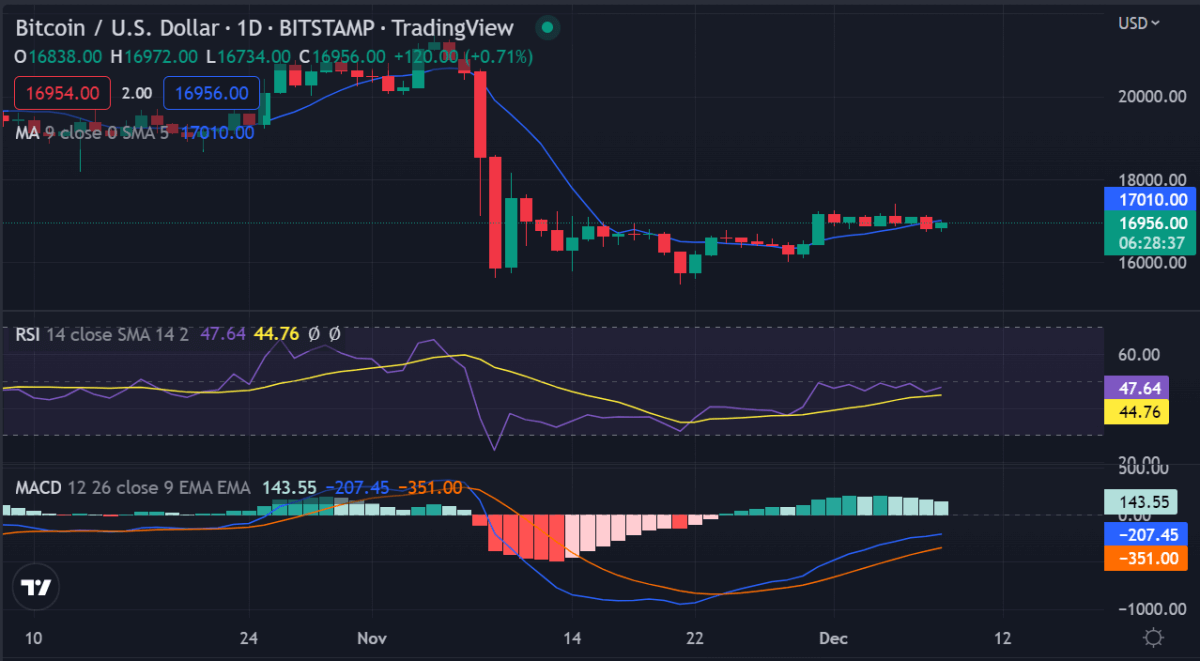
Although Bitcoin remains dormant for the most part, many believe that this is only a temporary phase and that BTC will soon begin to show some signs of life. There are several support levels in the $16,000-15,500 range that could act as potential triggers for an upcoming uptrend.
The Fibonacci retracement line is another indicator that suggests a possible bullish breakout. According to this line, BTC could reach levels of $17,500 or even higher in the coming weeks. This confluence of technical indicators could be enough to convince more investors to enter the market and enable Bitcoin to reach new highs.

Looking at the moving averages, we can see that the 100-day MA is turning bullish, which could indicate that a big price rally could be on the cards. The 200-day MA is also on a bullish path, meaning momentum could shift from the bears to the bulls. The immediate support level for BTC is set at $16,500 and the immediate resistance level is set at $17,500.
Bitcoin Price Analysis on a 4-Hour Chart: Bulls Hold the Edge
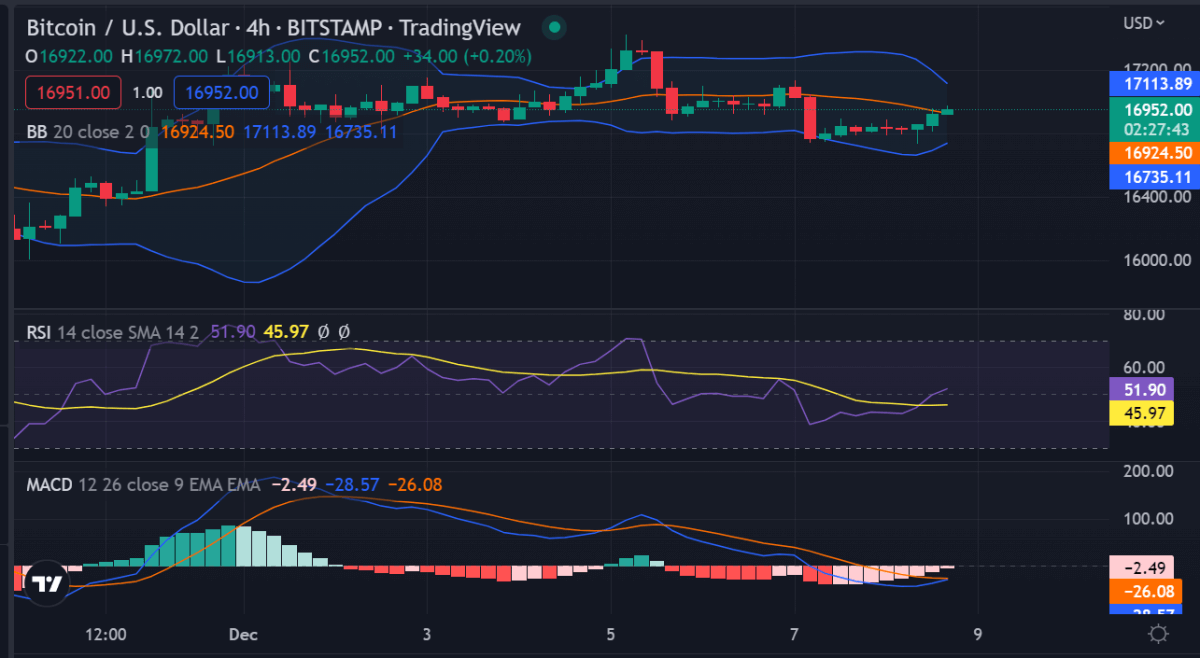
Bitcoin price analysis on a 4-hour time frame shows that Bitcoin has been trading at around $16,900 and the bulls have been able to push prices up to $16,943.91 where it is trading at. It has not been able to break above the key $17,600 resistance as it trades in this volatile $16,700-17,500 range.

The 4-hour MACD is slightly bullish with a positive crossover between the signal line and the MACD line. The Bollinger bands are narrow, indicating that volatility can be expected soon. The RSI is pointing downward, indicating a possible bearish breakout. Given the current level of bull momentum, there are high chances of Bitcoin breaking out to the upside and reaching levels near $17,000 or even higher in the next few hours.
Bitcoin price analysis conclusion
Bitcoin price analysis shows that Bitcoin has remained dormant for the past few days, hovering around $17,000. However, analysts believe that a bullish breakout could be near, driven by technical indicators such as the Fibonacci retracement line and moving averages. If Bitcoin manages to break out of its current range, it could rise to highs of $17,500 or even higher in the coming weeks. However, if the bears regain control of the market and push prices below $16,000, we could see another decline in value.
While you wait for Bitcoin to move forward, check out our price estimates on XDC, Cardano and Curve.


