Bitcoin Forms Bump And Run Reversing Bottom, Target Is $100,000
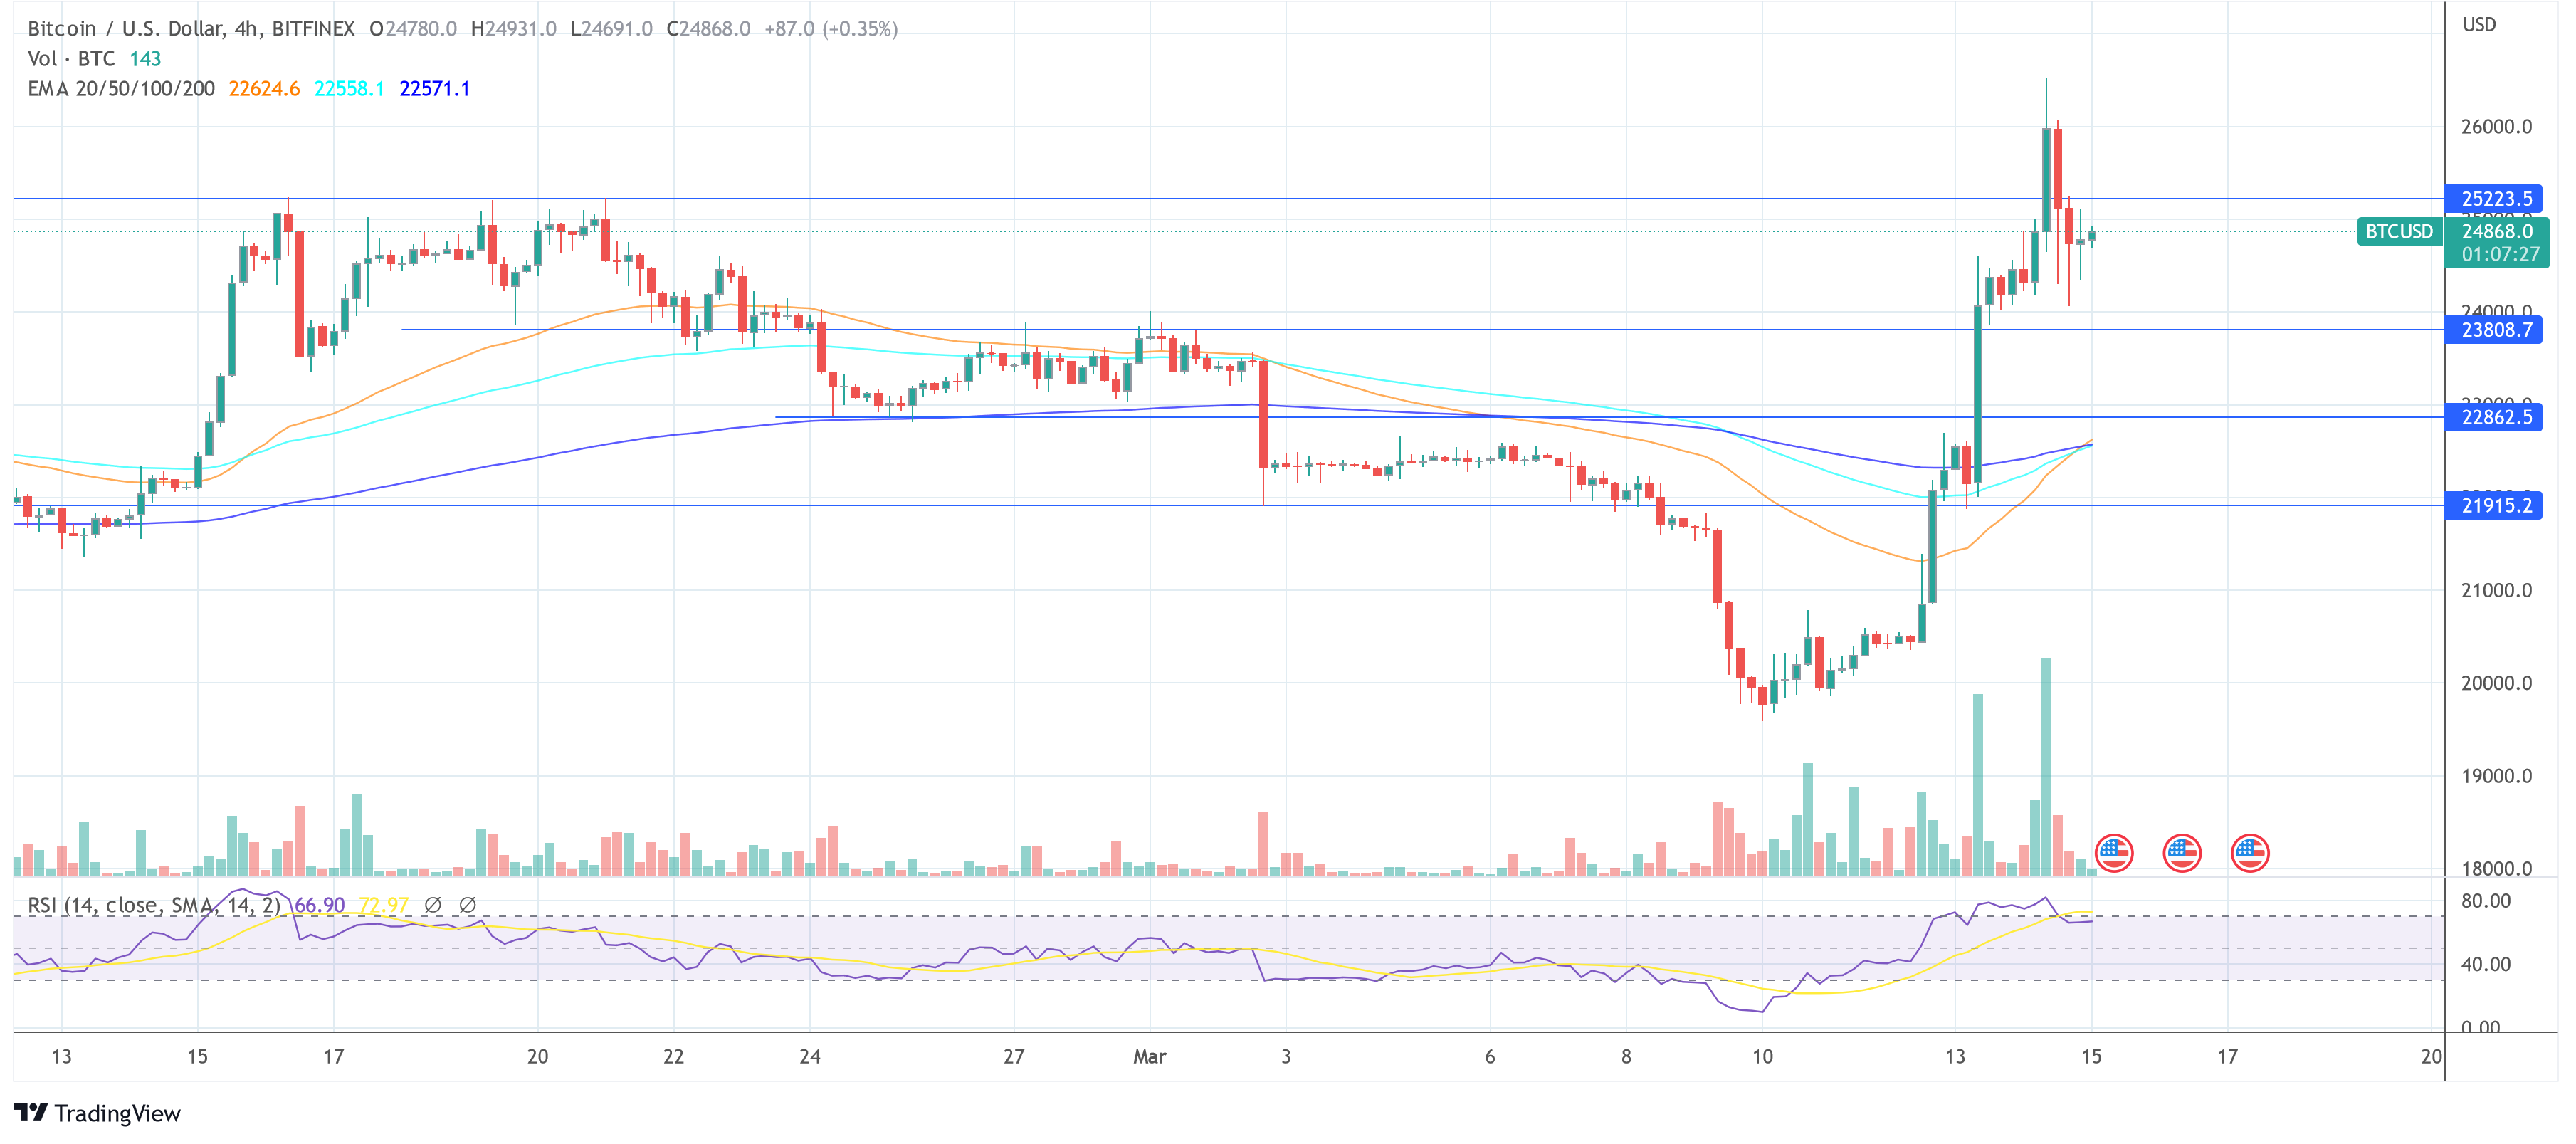
After Bitcoin surged above $26,500 following yesterday’s release of the US Consumer Price Index (CPI), the price experienced a sharp correction. BTC price briefly fell just below $24,000. At the time of writing, Bitcoin was trading at $24,868, below the key resistance of $25,200.
However, Charles Edwards, founder of Capriole Investments, has spotted an extremely bullish chart pattern for Bitcoin that could push the price above $100,000. Via Twitter, Edwards wrote, “The textbook perfect Bitcoin ‘Bump & Run Reversal’ bottom is back and the target is above $100 000.”
Here’s what the Bitcoin Bump And Run reversal entails
Bump And Run Reversal (BARR), as the name suggests, is a reversal pattern that occurs when excessive speculation drives prices down too much, too fast, until they reach extreme lows. The pattern, developed by Thomas Bulkowski, was also included in his book “Encyclopedia of Chart Patterns”.
The pattern consists of three main phases: entry, bump and uphill. As Edwards shows in the chart below, Bitcoin price has formed the lead-in phase of the 3-day chart from November 2021 to May 2022, beginning with a series of descending highs contributing to the initiating trend line.
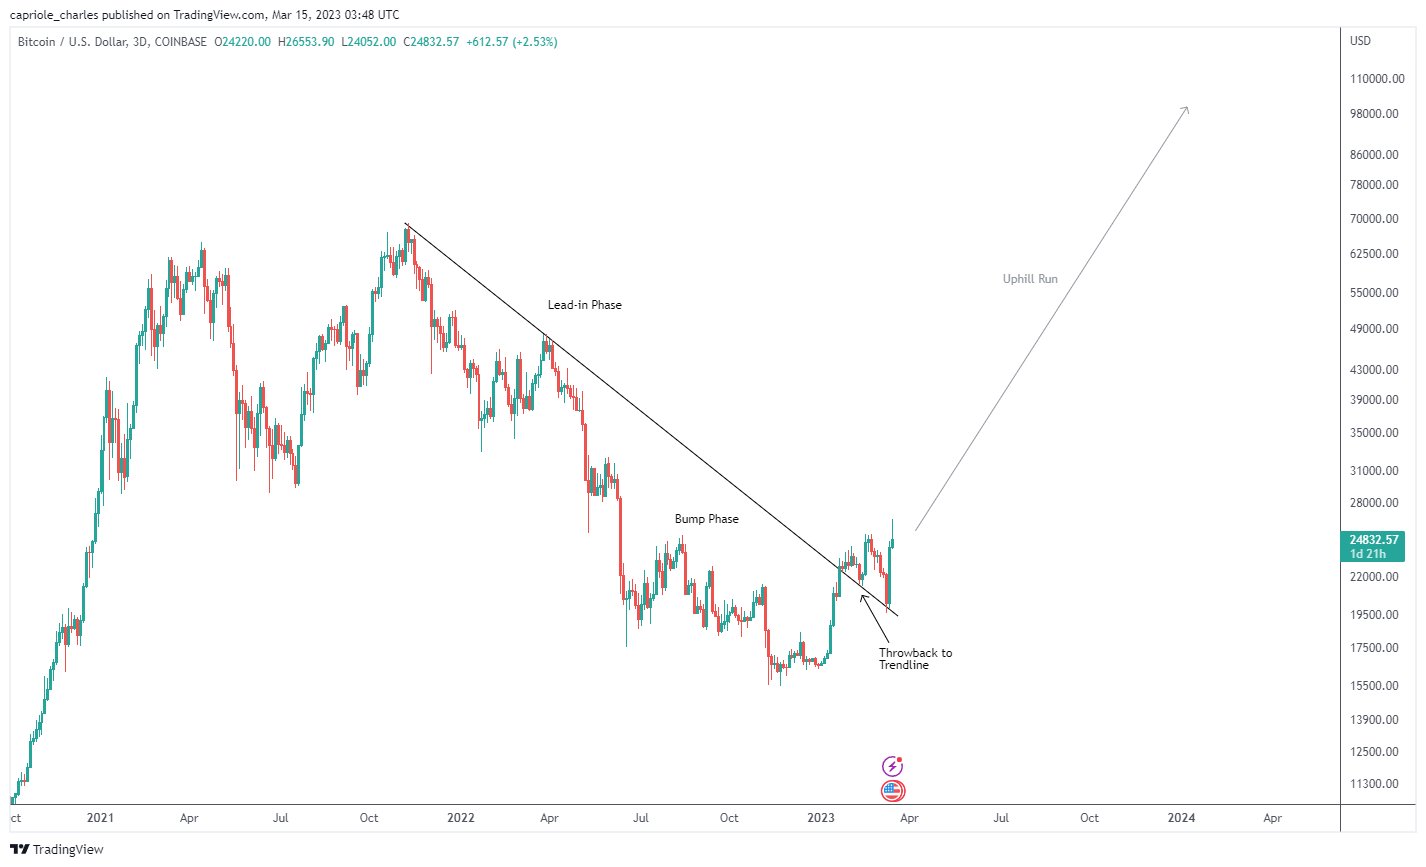
The bump phase begins with a sharp drop, and the price moves further away from the trend line. This phase began for Bitcoin in June 2022 when the price experienced a sharp drop before further shocks occurred, taking the price to new extreme lows.
At the end of the bump phase, BTC experienced a strong uptrend in January 2023, causing the price to break the trend line.
Both in mid-February and yesterday there was a pullback to the trend line, where the BTC price bounced upwards. With this, Bitcoin has confirmed the start of the uphill run phase, which starts when the pattern is broken. This phase could take Bitcoin to over $100,000 by mid-2024, according to Edwards.
More bullish chart patterns
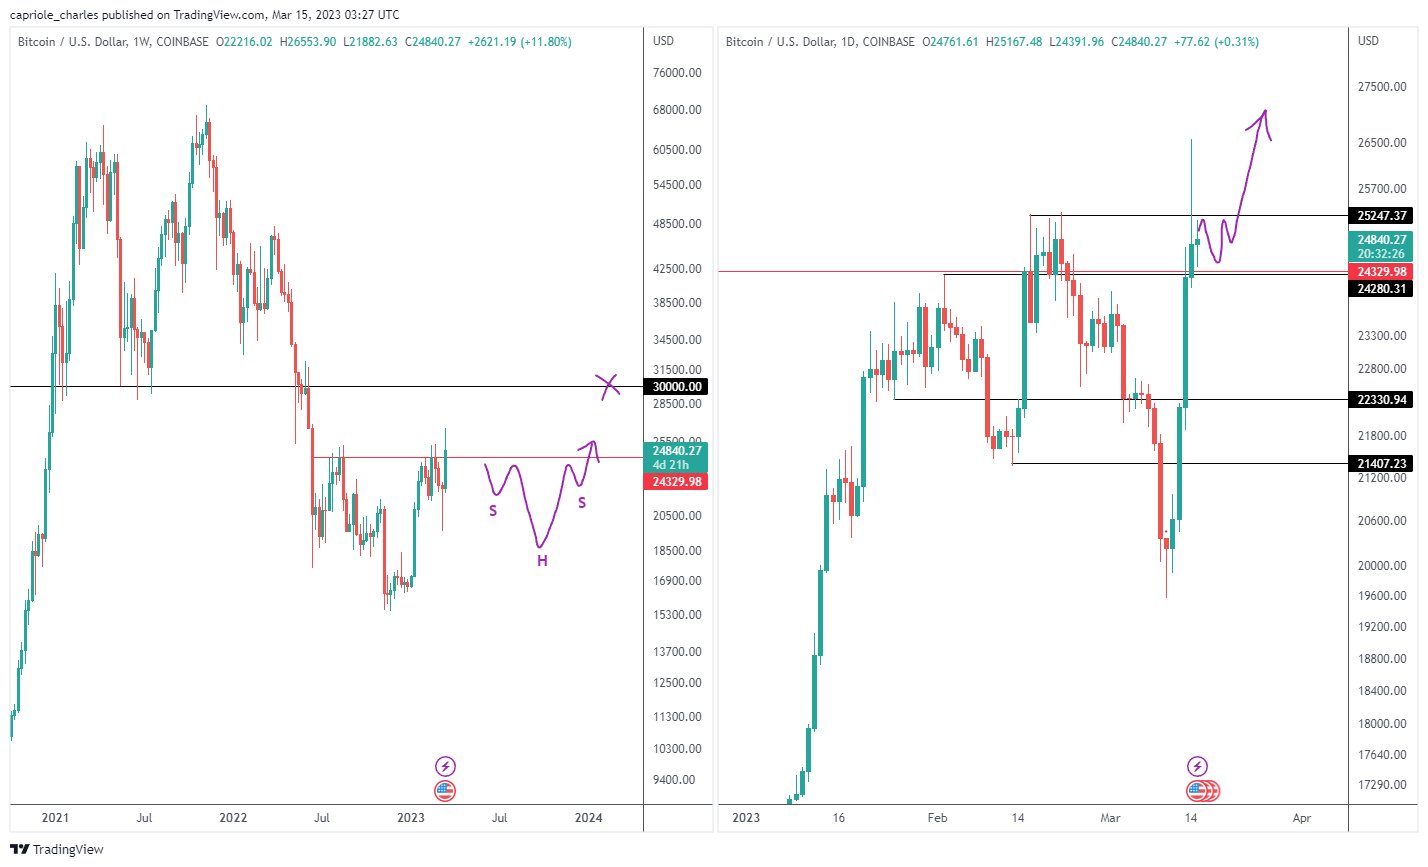
The Capriole Investments founder also found two more reasons to be bullish in the short to medium term. Sharing the following two charts, Edwards said via Twitter:
Head & Shoulders and Wyckoff accumulation at last resistance level before $30K. Close this week above $25 and it doesn’t get much better from an old tech perspective.
For now, $25,200 resistance remains the most important level that Bitcoin needs to break through to build bullish momentum. Back in February, the price was rejected three times by the opposition. Yesterday’s breakout did not last, and therefore it is still the limit for the start of a new bull run.
Featured image from iStock, chart from TradingView.com


