Bitcoin [BTC] long liquidations rise as prices crash below $23k, more on the inside
- Bitcoin’s latest pullback triggers heavy liquidation of leveraged long positions.
- According to the delta cap calculation, Bitcoin’s macro bottom was looming.
Bitcoin [BTC] has finally succumbed to capitulation after struggling to bounce off support around $23,000. A closer look at the dynamics of the recent bearish result revealed that long liquidations may have something to do with the downward momentum.
Is your portfolio green? Check out the Bitcoin Profit Calculator
Bitcoin’s long liquidation metric rose over the past 24 hours, proving that there was a large number of leveraged positions. Liquidations increased by over 360% within a few hours and this may have contributed to more selling pressure. Bitcoin currency reserves fell slightly despite the price drop and liquidations.

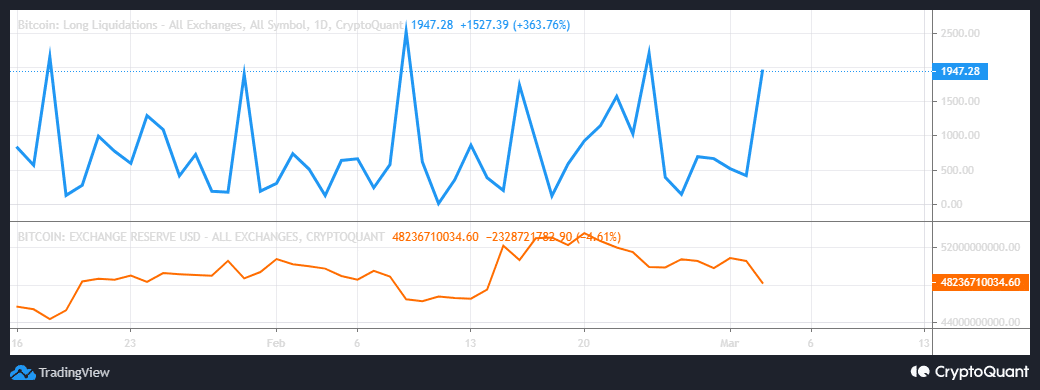
Source: CryptoQuant
Bitcoin’s performance this week extended the bearish momentum that prevailed since last week. Moreover, BTC’s extended downside reflected its inability to sum up enough demand to trigger a rally.

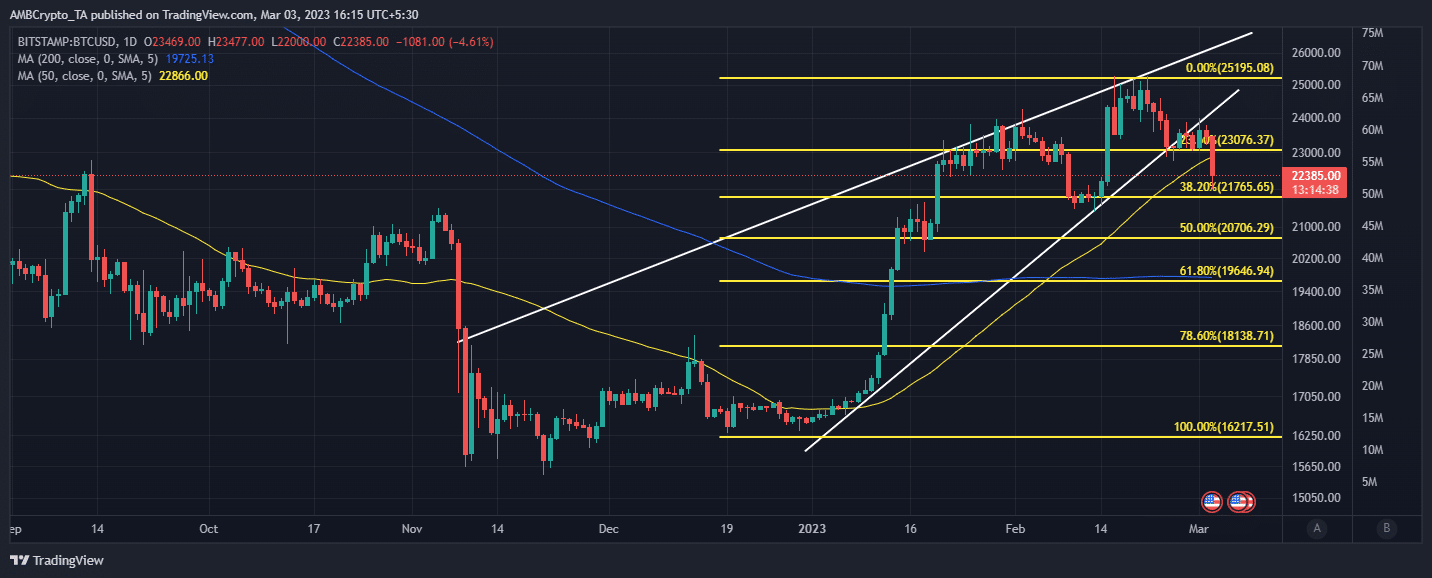
Source: TradingView
Traders should expect the next support area between $21,500 – $22,000 price range If Bitcoin maintained its press time trajectory, which was also within the 0.382 Fibonacci zone. The next major support area after that was $20,500 – $21,100.
Is this the start of March’s Bitcoin FUD?
Bitcoin’s recent price crash is not surprising because the Federal Reserve may end up announcing a rate hike. Such an outcome will have a negative impact on the market, as has been the case in the past. Now investors must assess the extent of selling pressure to predict whether the Fed will raise interest rates later this month.
Another big crash could see BTC crash potentially below $20,000 again. As such, investors will look to determine the next bottom in the event of another big bearish move. A recent CryptoQuant analysis suggested that the delta cap calculation may be one of the best tools for predicting market bottoms.
How much is 1,10,100 BTC worth today?
According to the analysis, Bitcoin’s price floor is often formed when the market value crosses with the delta axis. Such instances occurred in 2011, 2015 and 2018, and an extended pullback occurred after each crossing followed by the market’s recovery.

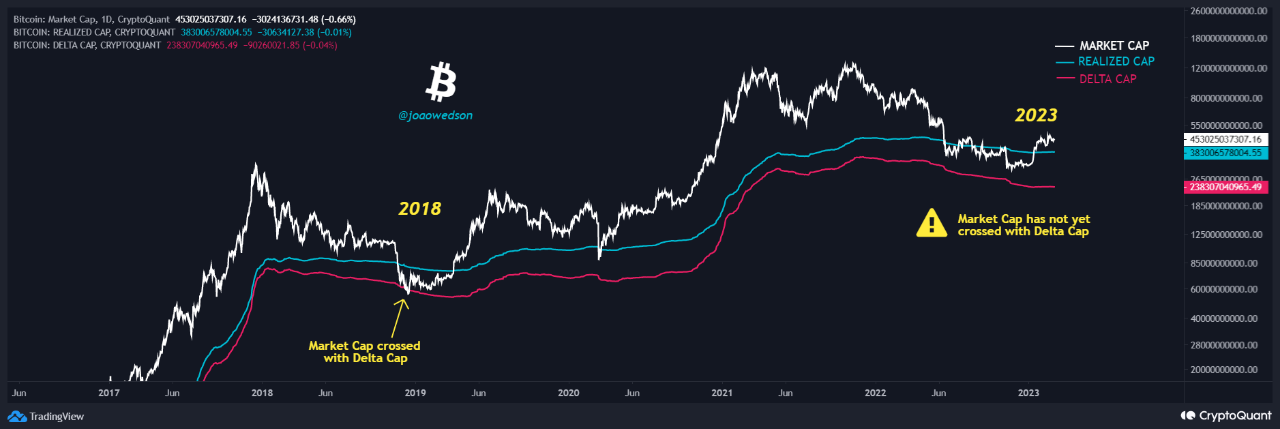
Source: CryptoQuant
If this analysis is correct, Bitcoin could be headed for an extended pullback in the coming weeks. However, this is an oversimplification considering the myriad of factors that affect Bitcoin’s demand or selling pressure. Nevertheless, the delta cap metric has been accurate in pinpointing macro bottoms and may indicate that the current bearish cycle is not yet over.


