Bitcoin Bearish Signal: Exchanges Receiving Large Deposits
On-chain data shows that Bitcoin exchange inflows have increased over the past day, which could prove bearish for the price of the crypto.
Average Bitcoin Exchange inflows have observed two peaks in the last 24 hours
As pointed out by an analyst in a CryptoQuant post, the two average inflow spikes were around 21 BTC and 17 BTC.
The “exchange inflow average value” is an indicator that measures the average amount of Bitcoin transferred to the wallet of centralized exchanges per transaction.
It differs from the usual inflow metric in that instead of just measuring the total number of coins flowing into exchanges, it tells us how large the average transaction of exchanges has been recently.
When the value of this indicator is high, it means that investors are depositing a lot of BTC to exchanges right now. Such a trend can be a sign of dumping in the market.
On the other hand, low values of the metric suggest that there is not much selling pressure in the Bitcoin market at the moment.
Now, here is a chart showing the trend of BTC exchange inflow average over the past few days:
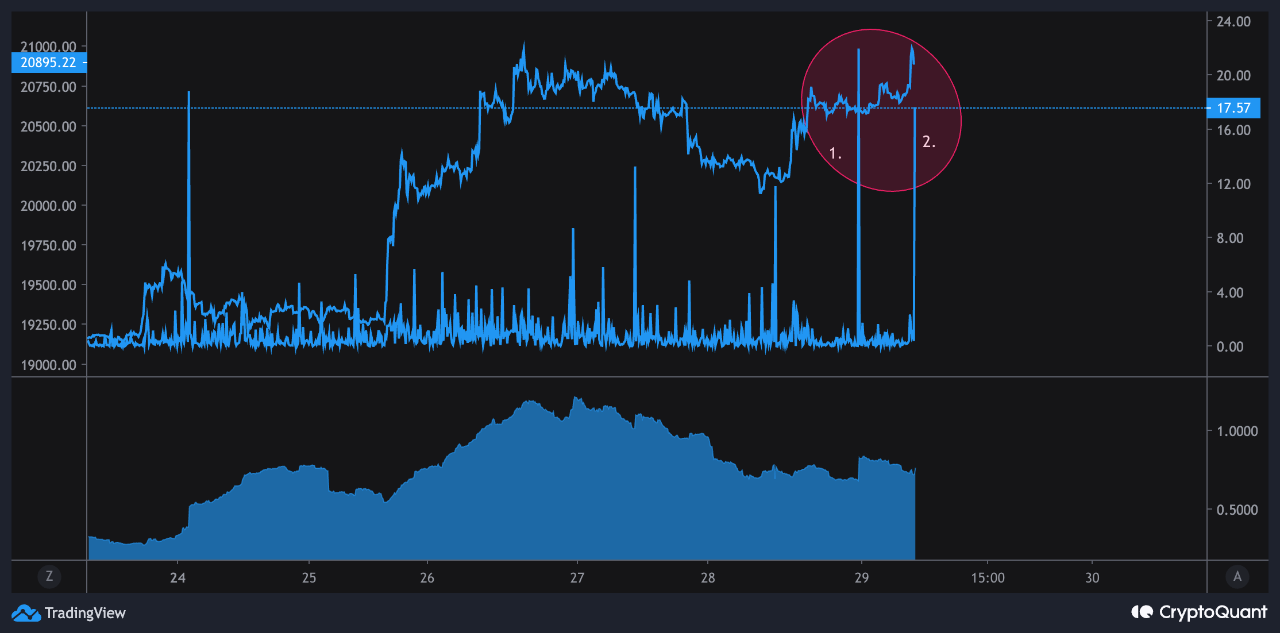
Looks like the value of the metric seems to have been quite high recently | Source: CryptoQuant
As you can see in the graph above, the average Bitcoin exchange inflow has seen a couple of peaks in the last 24 hours.
The first of these measured around 21 BTC, meaning that at the time it happened, the average transaction going to exchanges involved 21 coins. Similarly, the second peak had an average inflow value of more than 17 BTC.
Since these spikes have come as the price of the crypto has increased, they may come from whales trying to profit from the pump.
In the past, the occurrence of multiple Bitcoin exchange influxes means peaks greater than 15 BTC in value have generally been followed by a drop in the cryptocurrency.
Below is another chart that the same quant posted earlier in the month, showing a recent occurrence of this type of trend in the inflow average.
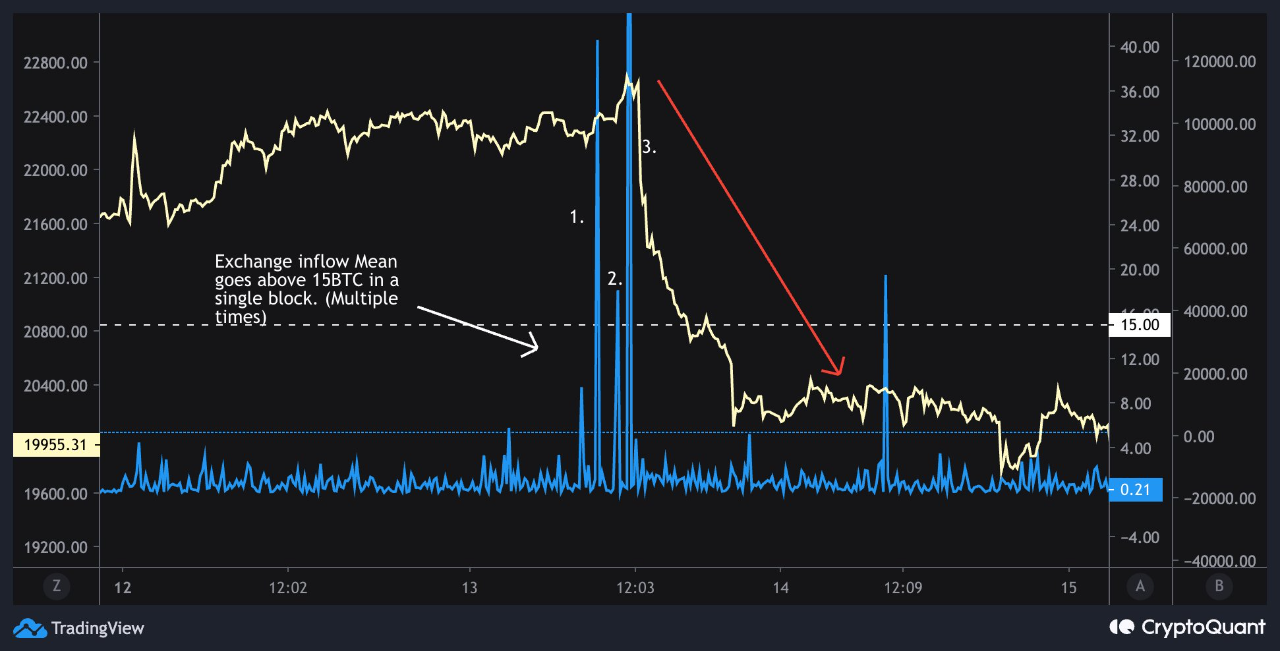
The exchange inflow mean spikes lead to the price going down | Source: CryptoQuant
BTC price
At the time of writing, Bitcoin’s price is hovering around $20.6k, up 8% in the last week. Over the past month, the crypto has risen 6% in value.
The chart below shows the trend in the price of the coin over the last five days.

The value of the crypto seems to have surged up recently | Source: BTCUSD on TradingView
Featured image from Hans-Jurgen Mager on Unsplash.com, charts from TradingView.com, CryptoQuant.com


")