Will Bitcoin Fall Further? Whales show signs of dumping
On-chain data shows that the Bitcoin exchange’s whale ratio has increased recently, which could lead to further downside in the asset’s value.
Bitcoin Exchange Whale Ratio has increased sharply recently
As pointed out by an analyst in a CryptoQuant post, the exchange whale ratio is currently at its highest level since September 2019. The “Exchange whale ratio” is an indicator that measures the ratio of the sum of the top 10 inflows to exchanges to total exchange inflows.
An “exchange inflow” is any movement of Bitcoin towards the wallets of centralized exchanges from addresses outside such platforms (such as self-deposit wallets).
The top 10 inflows here refer to the top 10 inflow transactions going towards these platforms. Usually these largest transfers come from the whales, so the exchange whale rate can tell us how the inflow activity of the whales today compares to the entire market (total inflow).
When this indicator has a high value, it means that these huge holders make up a large part of the total inflows at the moment. Since one of the main reasons investors move their coins to exchanges is for sales-related purposes, this type of trend could be a sign that whales are selling right now.
On the other hand, low values of the metric suggest that this cohort does not have too many inflows compared to the rest of the market. Such a trend can be either neutral or bullish for the cryptocurrency’s price, depending on some other market conditions.
Now, here’s a chart showing the trend in Bitcoin exchange whale ratios over the past few years:
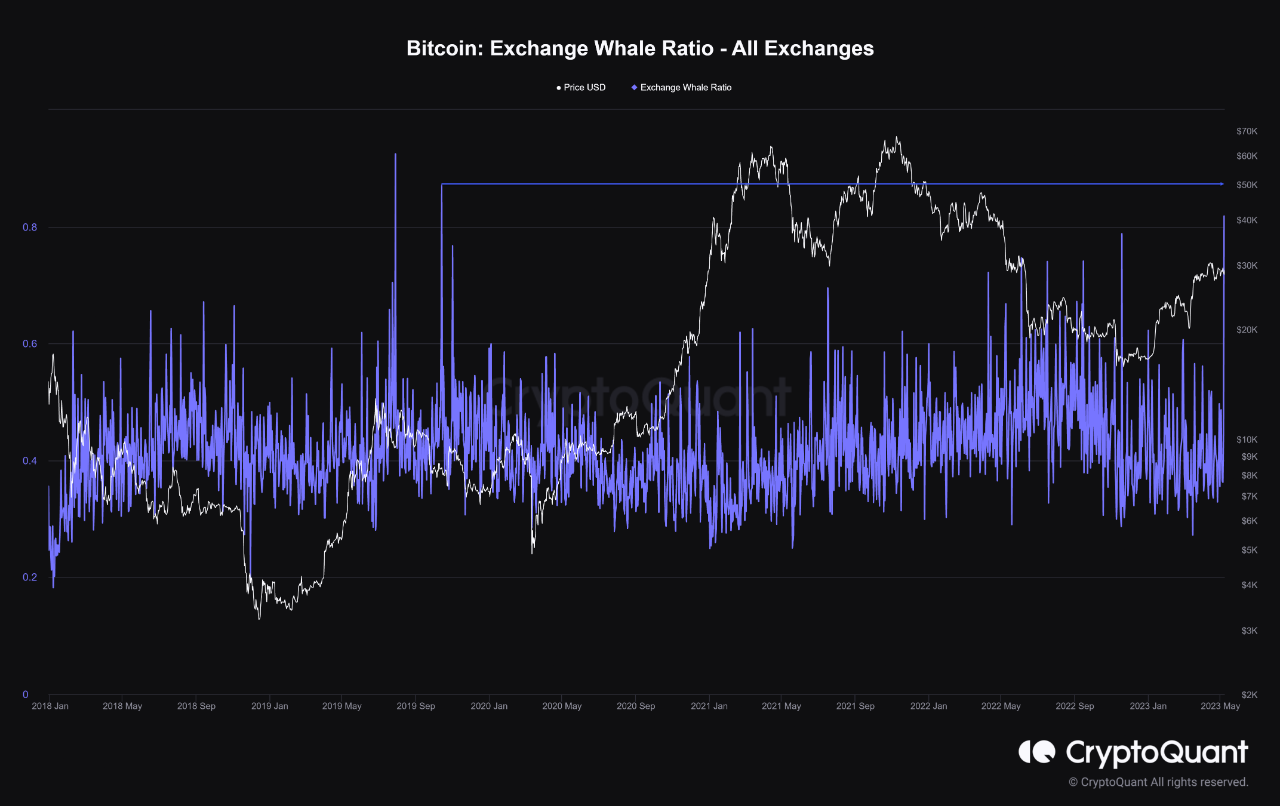

Looks like the value of the metric has been pretty high in recent days | Source: CryptoQuant
As shown in the graph above, the Bitcoin exchange’s whale ratio has observed a fairly large peak recently. This suggests that whales make up a fairly large part of the total exchange supply at present.
The calculation has crossed the value of 0.8 in this rise, which suggests that more than 80% of the inflows are coming from these huge investors right now. This level of ratio has not been seen in the market since way back in 2019.
This previous peak of a similar scale occurred when the price came down from the rally in April 2019, and shortly after it took place, Bitcoin recorded an extension of its decline.
An even greater increase in the ratio was also observed earlier that year, around the time the aforementioned April 2019 rally peaked. The timing of these two peaks may indicate that it was the dumping from the whales that affected the market and caused the price to go down.
If these previous instances of whale influx activity at similar levels are anything to go by, Bitcoin price could face a bearish decline in the near term due to the current potential selling pressure from this cohort.
The pullback may also have already started, as the cryptocurrency’s price has taken a dive below the $28,000 mark today.
BTC price
At the time of writing, Bitcoin is trading around $27,900, down 2% in the last week.

BTC has plunged in the past day | Source: BTCUSD on TradingView
Featured image from Thomas Lipke at Unsplash.com, charts from TradingView.com, CryptoQuant.com


