Why this means the top is near
Bitcoin ended the last week with a return of around 35.8%; here is what has happened historically when the asset’s price has performed accordingly.
Bitcoin recorded 35.8% gains over the past week
BTC has continued its strong upward momentum of late, with the last week being one of the best weeks in cryptocurrency history as the coin managed to close it is 35.8% in the green.
According to the latest weekly report from Glassnode, only 16 trading days since 2015 have seen larger 7-day gains than the last rally, showing how rare and special such price increases have been.
Here is a chart showing the 7-day price performance data for Bitcoin since 2015:
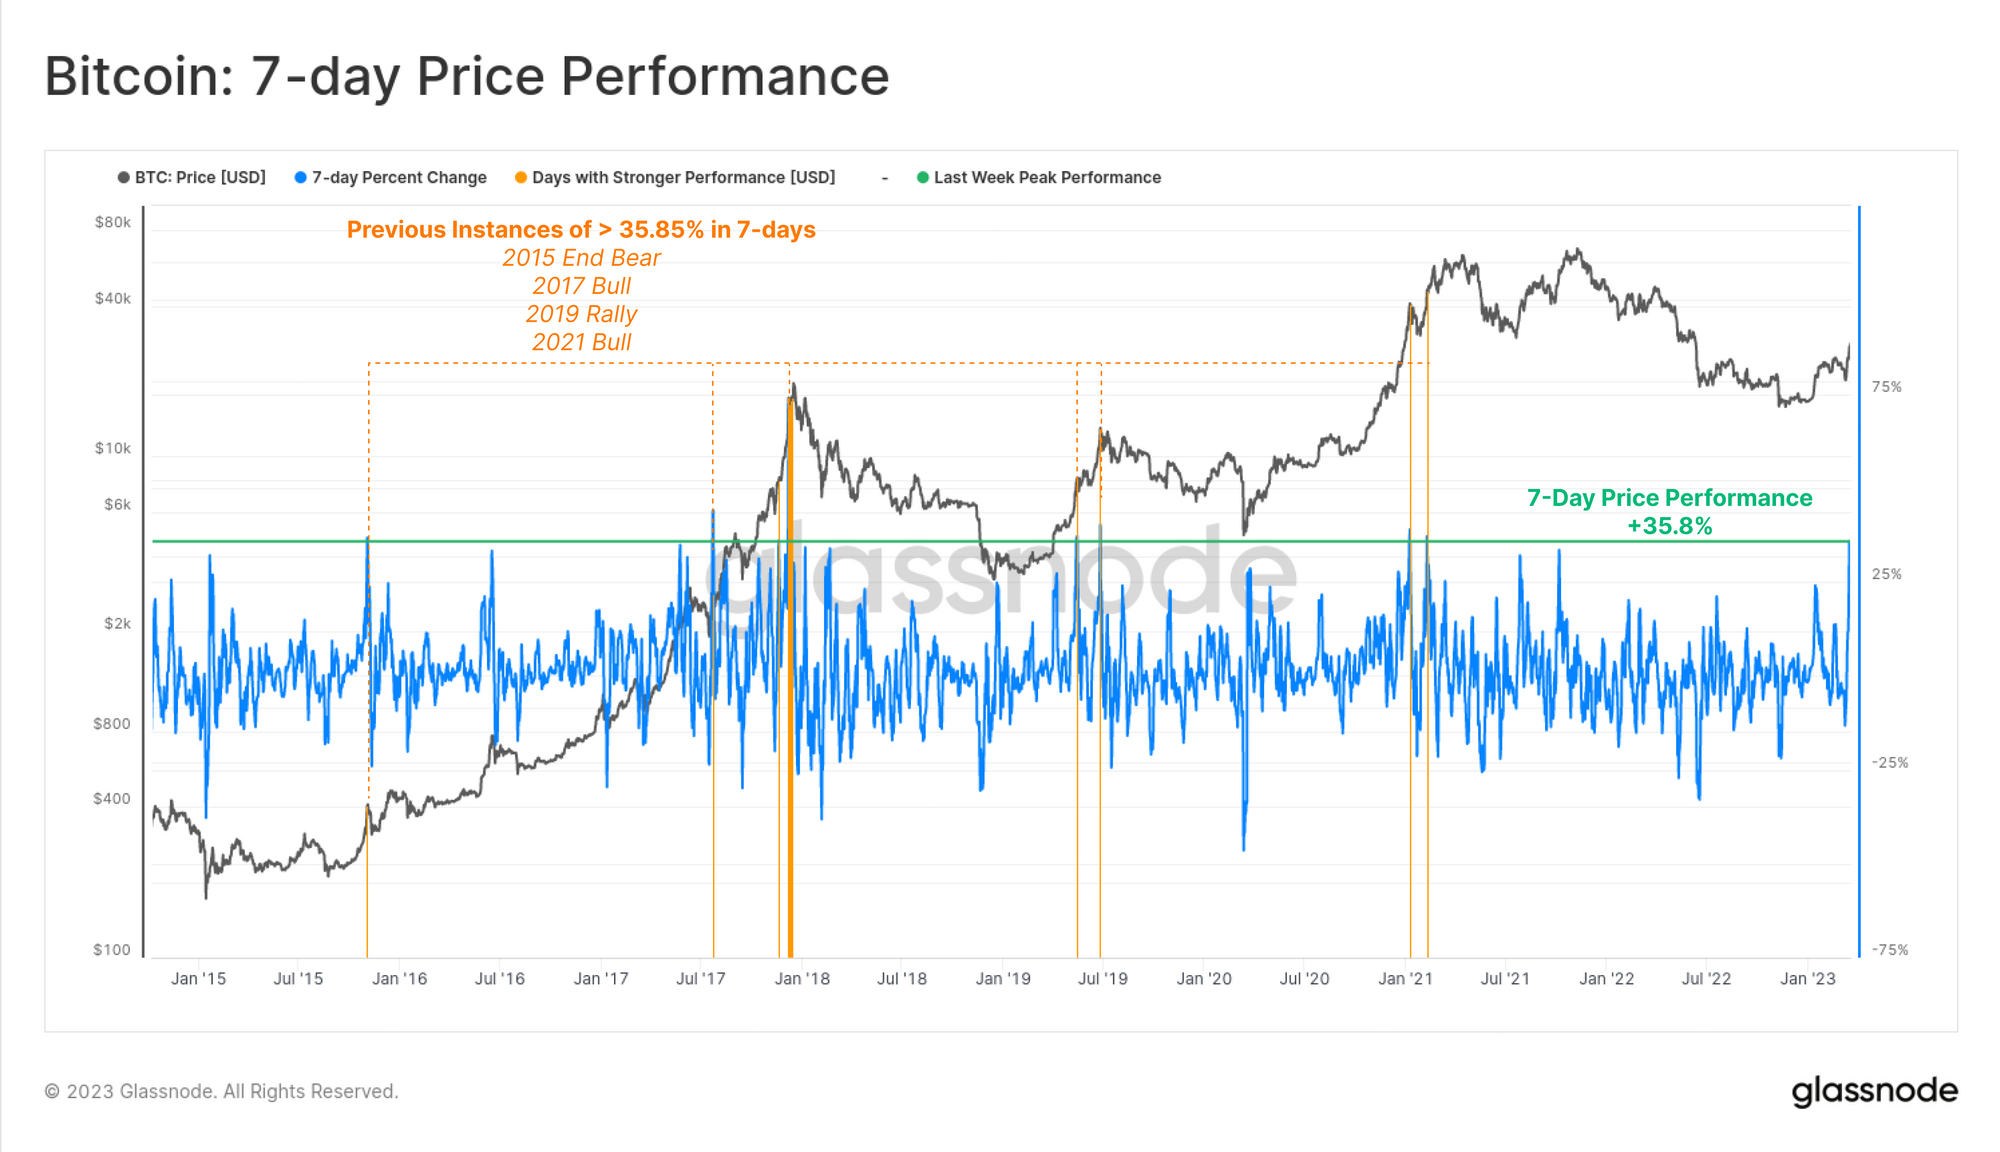

Looks like the value of this metric has been pretty high in recent days | Source: Glassnode's The Week Onchain - Week 12, 2023
In the graph above, Glassnode has highlighted (in orange) the previous instances for Bitcoin where the price showed a stronger 7-day percentage return than the last one.
It seems that the last time BTC saw a higher amount of 7-day gains was when the bull run in the first half of 2021 was almost at its peak. Likewise, several days of this trend were observed at the peak of the 2017 bull run.
The chart shows that these Bitcoin bull runs also saw an example of this trend as the rally was still on the rise, yet had entered the late stages.
A couple of instances of higher 7-day returns were also observed during the rally that took place back in April 2019. This mini-bull rally shares many similarities with the current one, as it also pulled BTC out of bear market lows.
The first trend was seen in the latter half of this rally, while the second was observed at the very top, much like the bull runs of 2017 and 2021.
All of these events suggest that Bitcoin has generally only seen days with such strong 7-day percentage returns when a bull rally has entered its late stages.
A clear exception to this occurred way back in 2015, when the end of the bear market in that cycle saw such returns, but the build-up to the bull rally was only in the early stages then.
If the current market is comparable to all these previous bull rallies, the 35.8% return that Bitcoin observed in the last week could mean that a top is near, or at least the rally has entered its late stages.
Of course, another trend is still not out of the realm of possibility, as the case at the end of the 2015 bear market already showed. However, it is still true that such a trend has not been repeated all these years since then.
BTC price
At the time of writing, Bitcoin is trading around $27,900, up 16% in the past week.

BTC seems to have dipped below $28,000 | Source: BTCUSD on TradingView
Featured image from Kanchanara on Unsplash.com, Charts from TradingView.com, Glassnode.com


