Why Bitcoin Looks Like It’s Going Higher
A confused “RSI divergence” looks bullish for Bitcoin … another technical tailwind for the crypto sector … why Luke Lango sees disinflation in 2023 helping crypto … a big “AI” event tomorrow
Every day that Bitcoin’s price doesn’t pull back significantly increases the chances that we’re about to see a big bullish leg higher.
The reason stems from a divergence in Bitcoin’s relative strength index (RSI).
To make sure we’re all on the same page, the RSI is a technical indicator that helps show the strength and/or weakness of a stock. Most investors use the RSI to assess whether a stock is undervalued or overvalued.
And while certainly useful, there is another incredibly powerful use of RSI…
A divergence between the direction of the RSI and the direction of the share price often indicates that a change in the share price will soon follow.
For example, when the RSI begins to climb from oversold conditions while the stock price continues to fall, it suggests that you are headed for a bounce in the stock price.
To illustrate, look at the chart below of XLE, which is the Energy Select Sector SPDR ETF
From June to mid-July last year, you can see the price falling as the RSI starts ticking up a bit from the “oversold” level of 30 to 37…
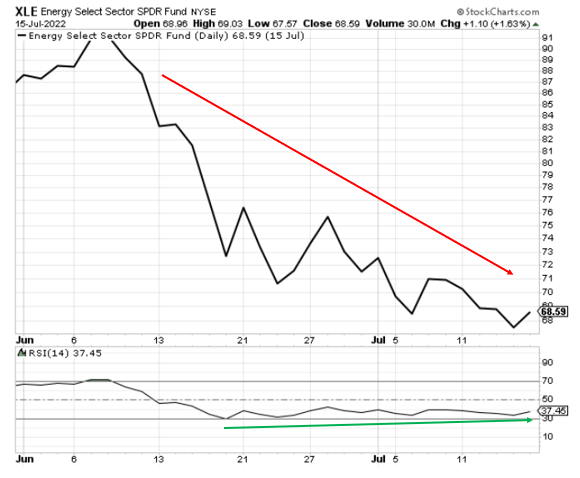
Source: StockCharts.com
See how the RSI level around July 15th was higher than the RSI level back around June 20th – even though the stock price was significantly lower?
That is the divergence we are talking about.
Here’s how this played out as July ended…
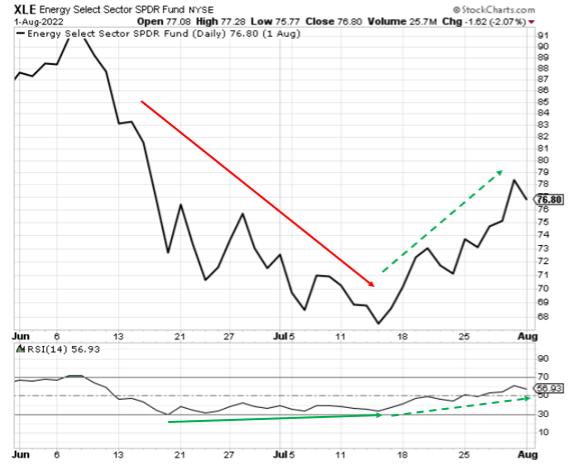
Source: StockCharts.com
You’ll often see this dynamic work in the other direction as well – and that brings us to Bitcoin
When a stock or asset is still climbing, but you see the RSI turning south from overbought levels, watch out. A reversal in asset price often follows.
And that was what seemed to be Bitcoin’s fate just a few weeks ago.
From our 9 February Digest:
Bitcoin has been grossly overbought. And if we look at the RSI for the past few days, it has fallen hard…
Take a look at this divergence.
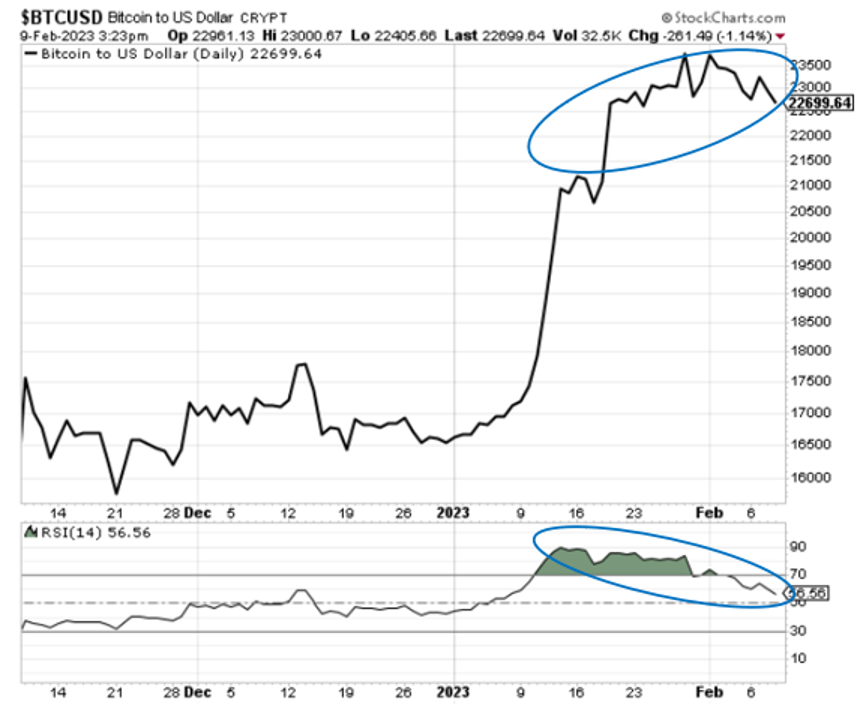
Source: StockCharts.com
From this chart, it appeared that Bitcoin was on the verge of a significant price drop.
But that didn’t happen.
The RSI divergence failed – instead, here’s how things worked
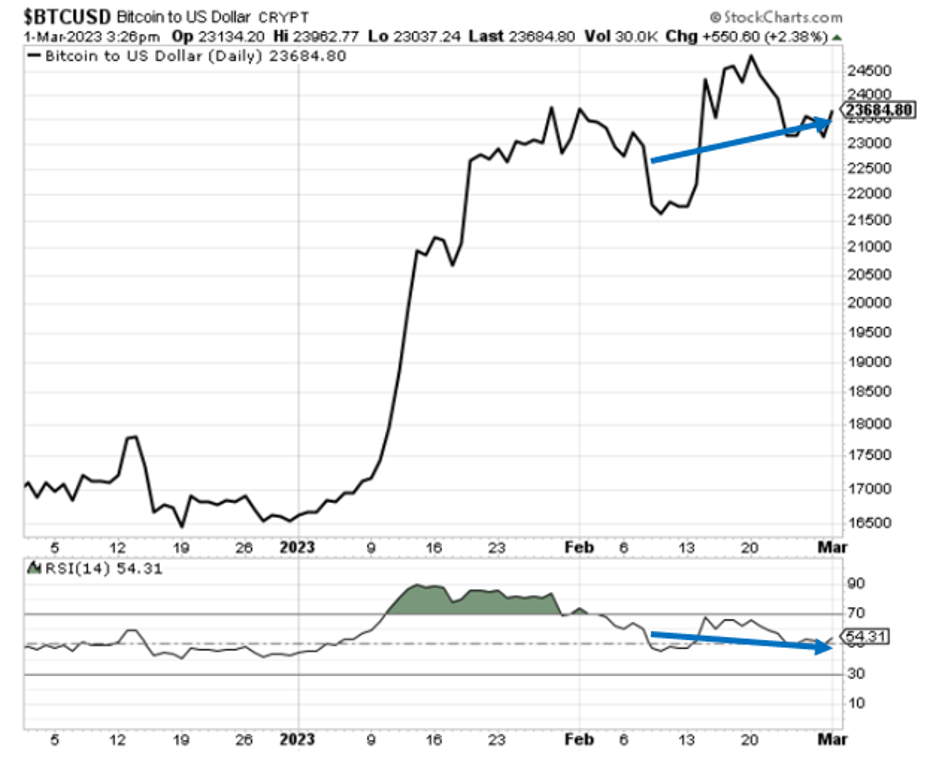
Source: StockCharts.com
While Bitcoin’s price pulled back, the decline was relatively mild. It never fell below $21,500.
Meanwhile, the nosebleed RSI reading normalized and now appears to be turning north again from the midpoint reading of “50.”
So how do we interpret this?
Well, that’s how we started today Digest“every day Bitcoin’s price doesn’t pull back significantly increases the chances that we’re on the verge of seeing a significant bullish leg higher.”
If Bitcoin’s price does not fall roughly parallel to the RSI level, then the situation goes from bearish to bullish quickly. That’s because the new interpretation is that Bitcoin’s RSI is simply “reloading.”
An analogy is that a spring compresses, getting ready for another “pop”. If you’re an older investor like me, remember how you used to pull back the spring-loaded “ball thrower” in an old-fashioned pinball machine.
But this crazy divergence isn’t the only bullish technical event happening to Bitcoin
For another, let’s turn to our crypto expert Luke Lango Ultimate Crypto.
Although his investment service focuses on cutting-edge altcoins, Bitcoin remains the barometer of the crypto sector. So, to get a sense of where the sector is headed, Luke’s analysis begins with Bitcoin.
From Luke:
We would like to highlight that Bitcoin’s 100-day moving average (MA) is close to crossing over its 200-day mark for the first time in this cycle.
The 100-day costs $19,400. The 200 day is just above $19,700. A small rally out of BTC and the 100 day will cross above the 200 day.
Historically, every previous crypto boom cycle was confirmed by the 100-day crossing above the 200-day.
Here is a diagram to help you visualize what Luke is writing.
Bitcoin’s 100-day MA is in blue and its 200-day MA is in red. To me, this crossover seems to be happening at this very moment.
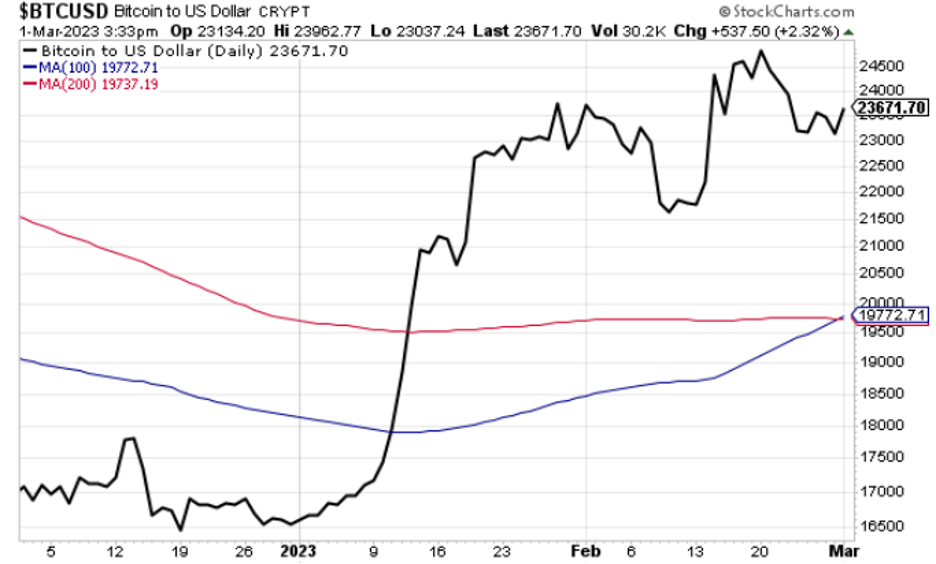
Source: StockCharts.com
Back to Luke:
Equally important, this “golden cross” indicator has no false signals.
Whenever BTC’s 100-day MA crossed above its 200-day after a prolonged fall, BTC rallied over the next few months (and often over the next few years).
But all this technical analysis is short-term – what about the long-term variables affecting crypto?
Crypto remains vulnerable to the Fed…and the Fed still relies on inflation data.
But Luke sees a continuation of cooling inflation data that will support crypto gains.
Back to his update:
…Everyone is afraid of re-inflation these days because, technically, according to the inflation data, as measured by a gauge favored by the Federal Reserve, the US economy experienced “re-inflation” in January…
But re-inflation months are a natural part of the disinflation process.
Back in the great disinflation cycle of the mid-1970s, we had four months of PCE reinflation—none of which ended the disinflationary trend. In the great disinflation cycle of the early 1980s, we had 12 months of PCE re-inflation – none of which ended the disinflation cycle.
Historically, during disinflation cycles, we tend to get one month of re-inflation for every six months of disinflation…
Luke goes on to cite additional historical data on periods of disinflation, concluding that the current cycle of disinflation is likely to last at least through the summer (and likely into 2024), while inflation rates should fall by at least another 100 basis points (and likely 300). to 400 basis points).
As for the impact on crypto prices, here’s Luke’s takeaway:
Basically, we believe that the US economy’s disinflationary trend remains intact, and by extension, the rally in risky assets – including crypto – does as well…
We believe market conditions will improve meaningfully in March, and we stand by our call for BTC to double and several altcoins to rise 200% plus in 2023.
Given this outlook, we think now is a pretty good time to go dip buying…
For more of Luke’s crypto research as a Ultimate Crypto subscriber, click here.
Shift gears, put an important “artificial intelligence” event on your radar
Regularly Digest readers know that beyond crypto, Luke is also our tech hypergrowth expert.
Today, all the headlines in the tech world have one thing…
Artificial Intelligence (AI).
In the wake of ChatGPT, every stock with even the slightest trace of AI exposure has exploded. As just an illustration, look at the latest stock chart of the company C3.ai…
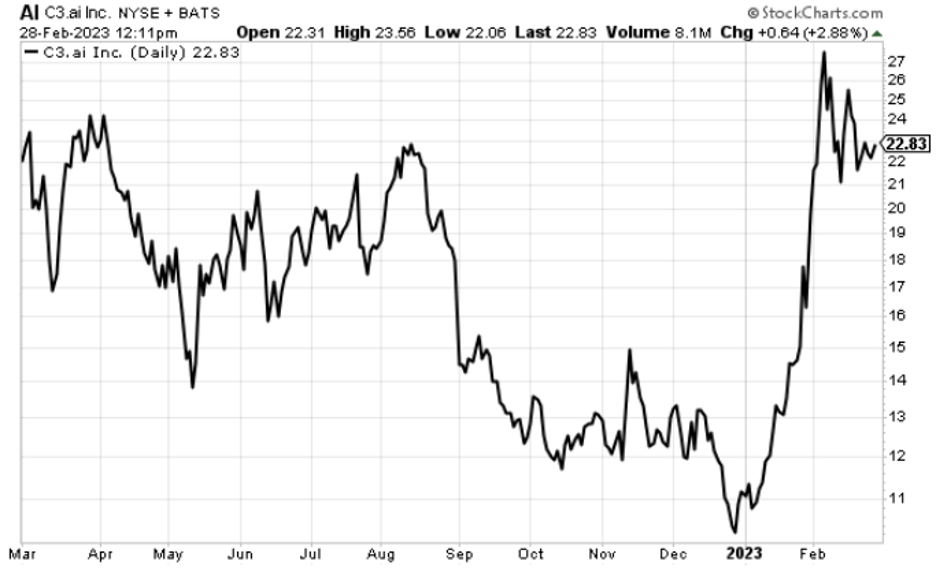
Source: StockCharts.com
With this as our context, let’s turn to Luke:
What’s happening in AI … especially since that day in November when ChatGPT turned the AI world upside down … is much bigger.
In short, I think AI adoption rates are about to explode.
And adoption creates opportunities.
That is why my team and I have put together a roadmap to help you navigate the coming AI revolution – we call it AI Super Summit.
And it takes place this Thursday, March 2nd at 4pm ET.
Joining me on camera will be my friend and fellow trader, Eric Fry. Together, we’ve managed to find six different AI stocks that can show you 10X gains or higher.
We will give you more details about the event and the investment opportunity tomorrow Digestbut we wanted to get this out to you today so you can write it into your schedule.
AI is going to change our everyday lives. And a handful of top-tier AI stocks are going to make literal fortunes for those lucky investors who see what’s coming and position themselves accordingly.
Join Luke and Eric tomorrow at 4pm EST for all the details on what’s in the pipeline, as well as a plan on how to get ahead of the game. Click here to reserve your place today.
As we come full circle to Bitcoin, unless we see the price weakness develop very quickly, get ready, because another leg higher is likely on the way.
Have a nice evening,
Jeff Remsburg


