What is a crypto trend reversal? How do you spot one before it happens?

In crypto trading, trends and patterns say everything. Many keen traders closely monitor graphs and other statistics to find out how the market will change or how it is changing.
Trends begin, end and even reverse. Crypto trend reversals are not uncommon, but what causes them, what do they look like and what warning signs should you look for?
Crypto trends explained
Crypto prices largely depend on trends. When a particular coin or token becomes popular, a wave of investors can move to buy it. This increases demand for the token, increasing its value. On the other hand, if many crypto holders dump it, the supply will exceed the demand, causing the price to fall.
In general, you either have a bearish or bullish crypto market. A bearish market occurs when the demand for crypto falls below the supply, while a bullish market occurs when the demand exceeds the supply. Bear markets lead to price falls, while bull markets lead to price increases.
This is the most familiar trend pattern you will see in cryptographs, although there are many types of trends. You need to know how to identify primary, secondary and tertiary crypto trends to help you trade more effectively. And there are times when these trends reverse unexpectedly.
Reversals can technically be large or small, but usually involve more significant price movements. Smaller reversals are more commonly referred to as pullbacks. A crypto trend can last days, weeks, months or even longer, depending on how investors and platforms receive the asset in question.
But what exactly is a crypto trend reversal and how does it affect the market?
What is a crypto trend reversal?
Crypto trend reversal (not to be confused with reversal trading) occurs when a consistent rise or fall in an asset price reverses. Such changes in price can be quick and short-lived or can extend over months or years. Longer trend reversals can be harder to spot, as they happen gradually and discretely, not suddenly.
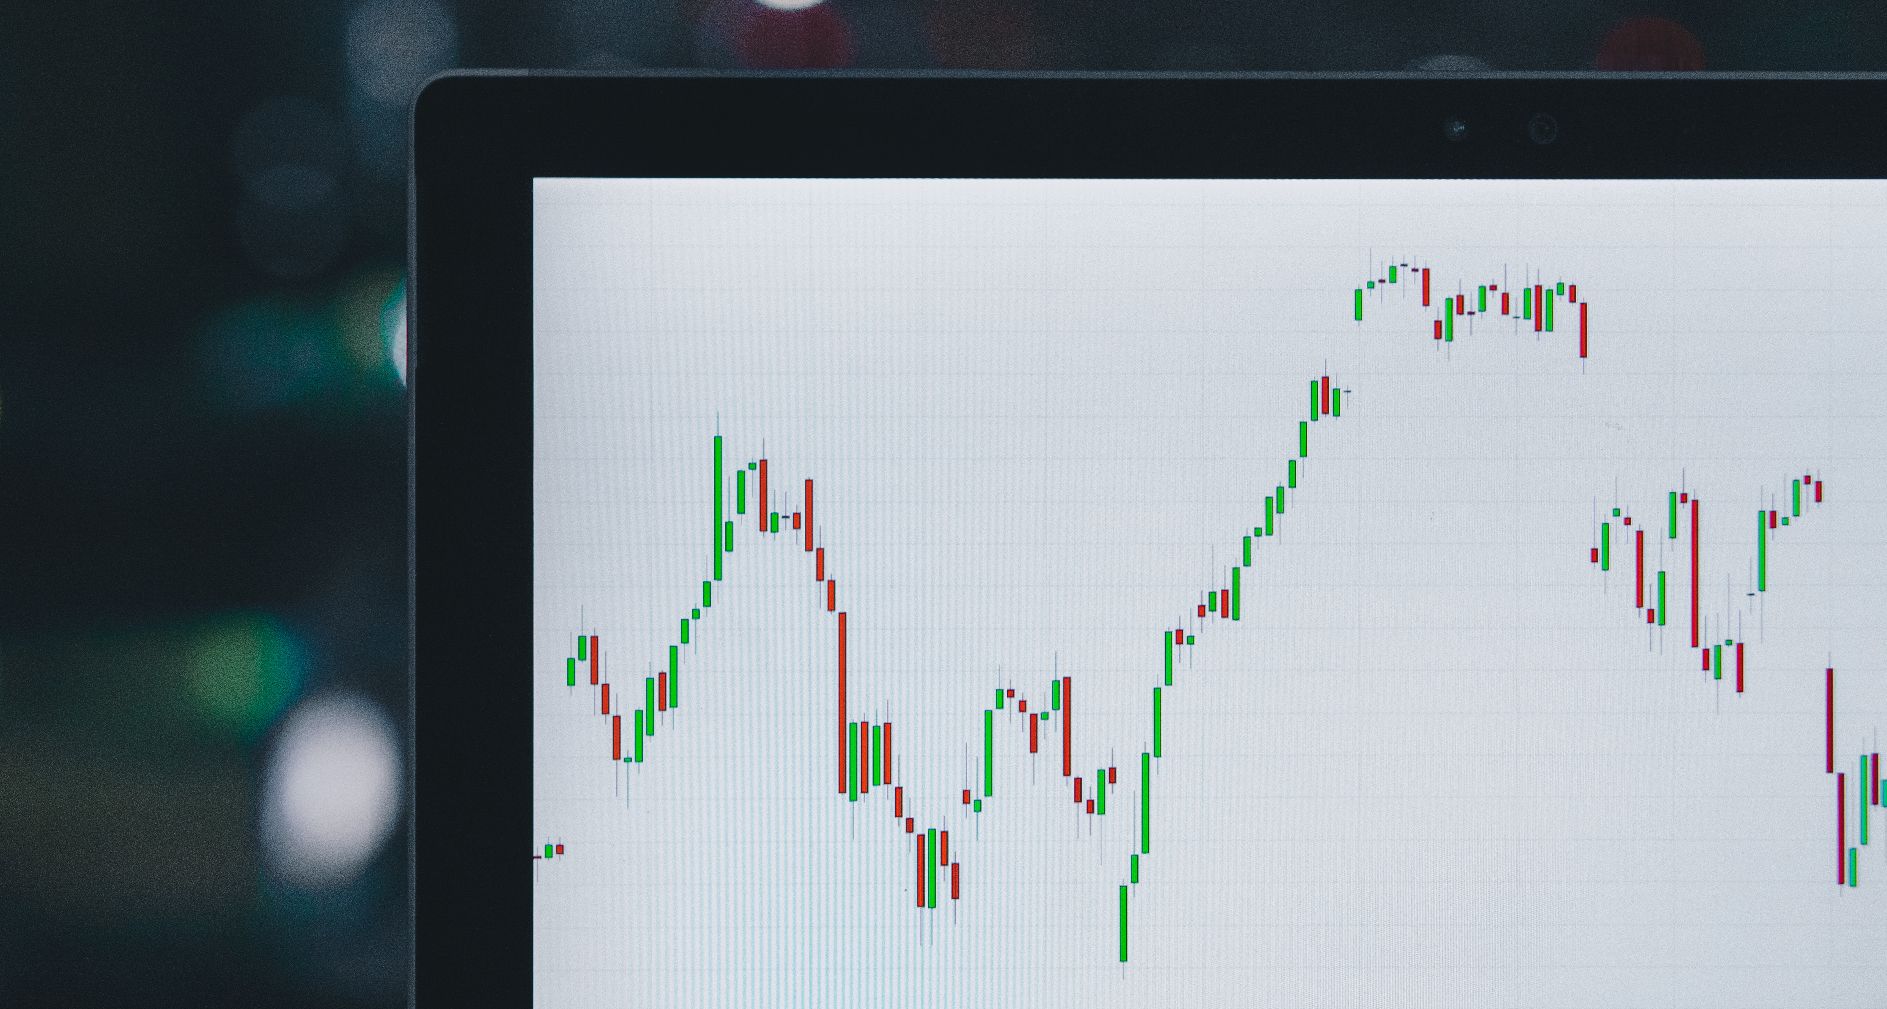
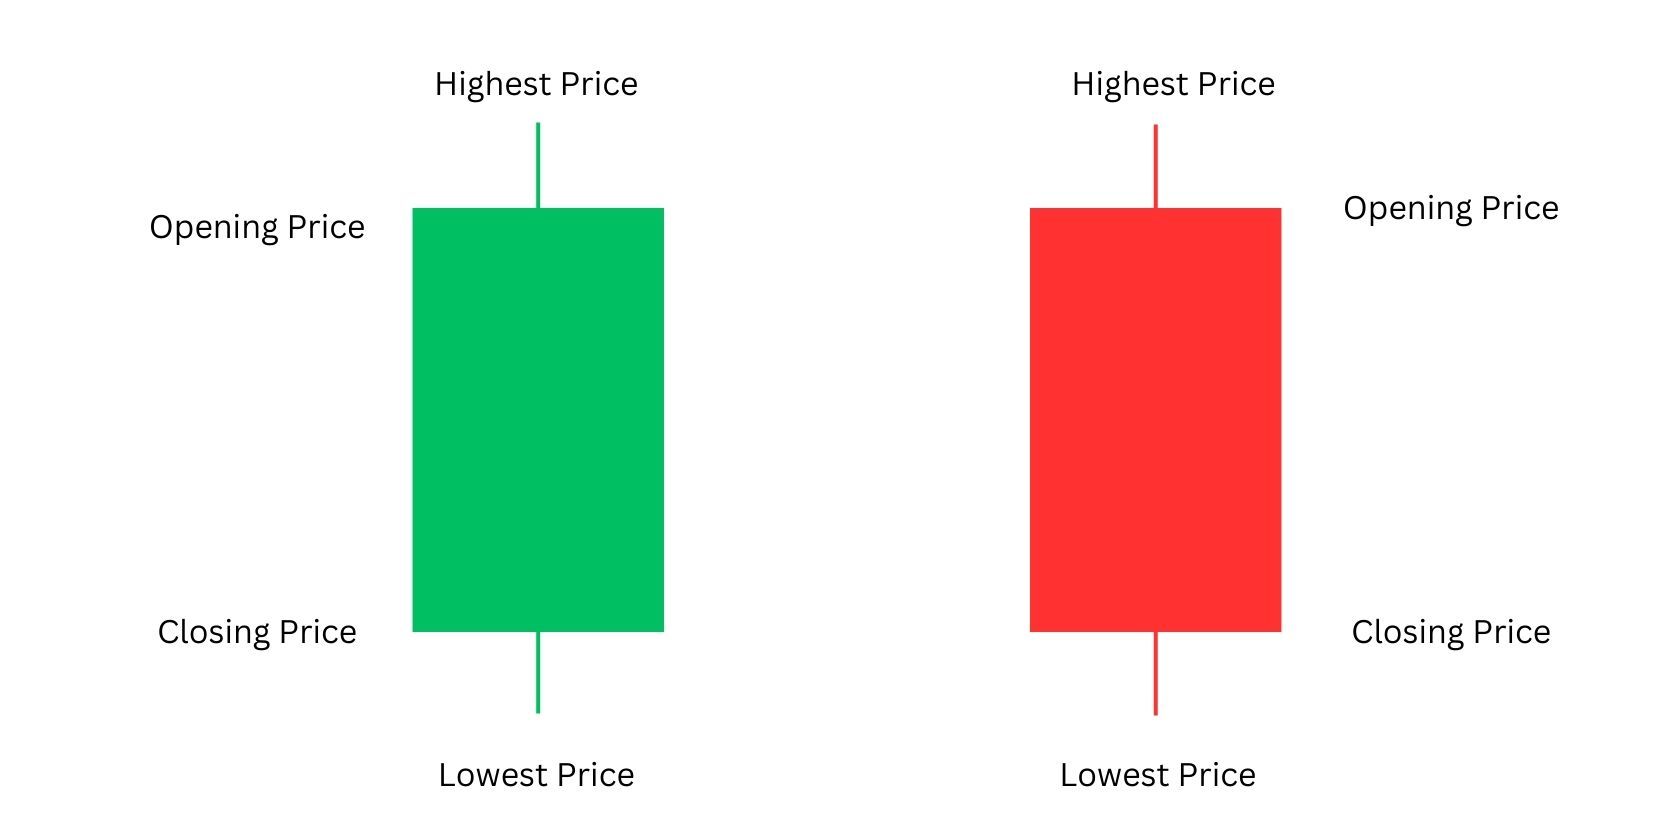
Crypto trend reversals show up most clearly on candlestick pattern graphs, a common style of price chart used for crypto assets. A candlestick graph consists of thick vertical lines attached to thinner lines. Because of their appearance, they are known as candlesticks.
In a candlestick graph, the bars can be either green or red. Green bars indicate price increases, while red bars indicate price decreases. The main part of the stick marks an asset’s opening and closing price on a given day, week, month, etc., while the thinner lines at the end show the highest and lowest prices that the asset reached during that period.
So how do trend reversals show up in candlestick charts?
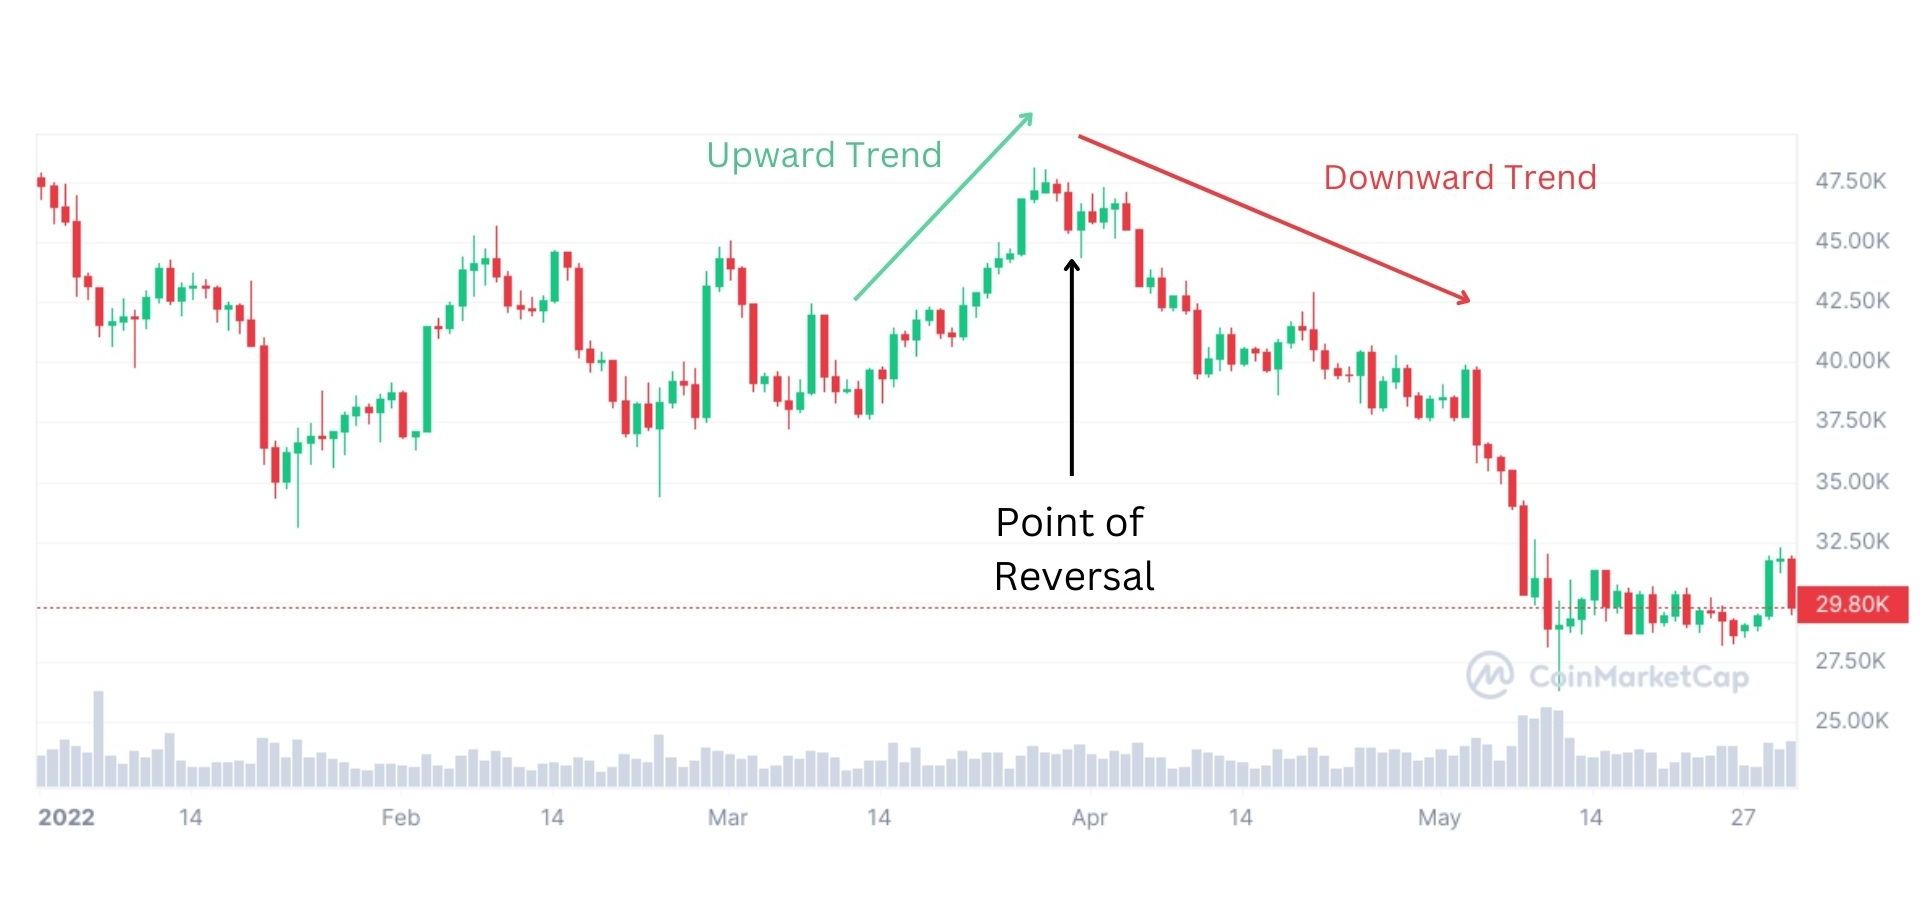
Below is a basic chart of a Bitcoin price trend reversal, clearly showing where the trend is starting to reverse.
As you can see, Bitcoin’s price was on the rise for a few weeks, but a point was reached where this started to change. As marked on the graph, this is the point where the trend reverses.
Trend reversals do not have to be uniform on either side of the reversal point, but must show a general change in price direction. What is needed is a set of lower lows and lower highs, followed by higher lows and higher highs, followed again by lower lows and lower highs.
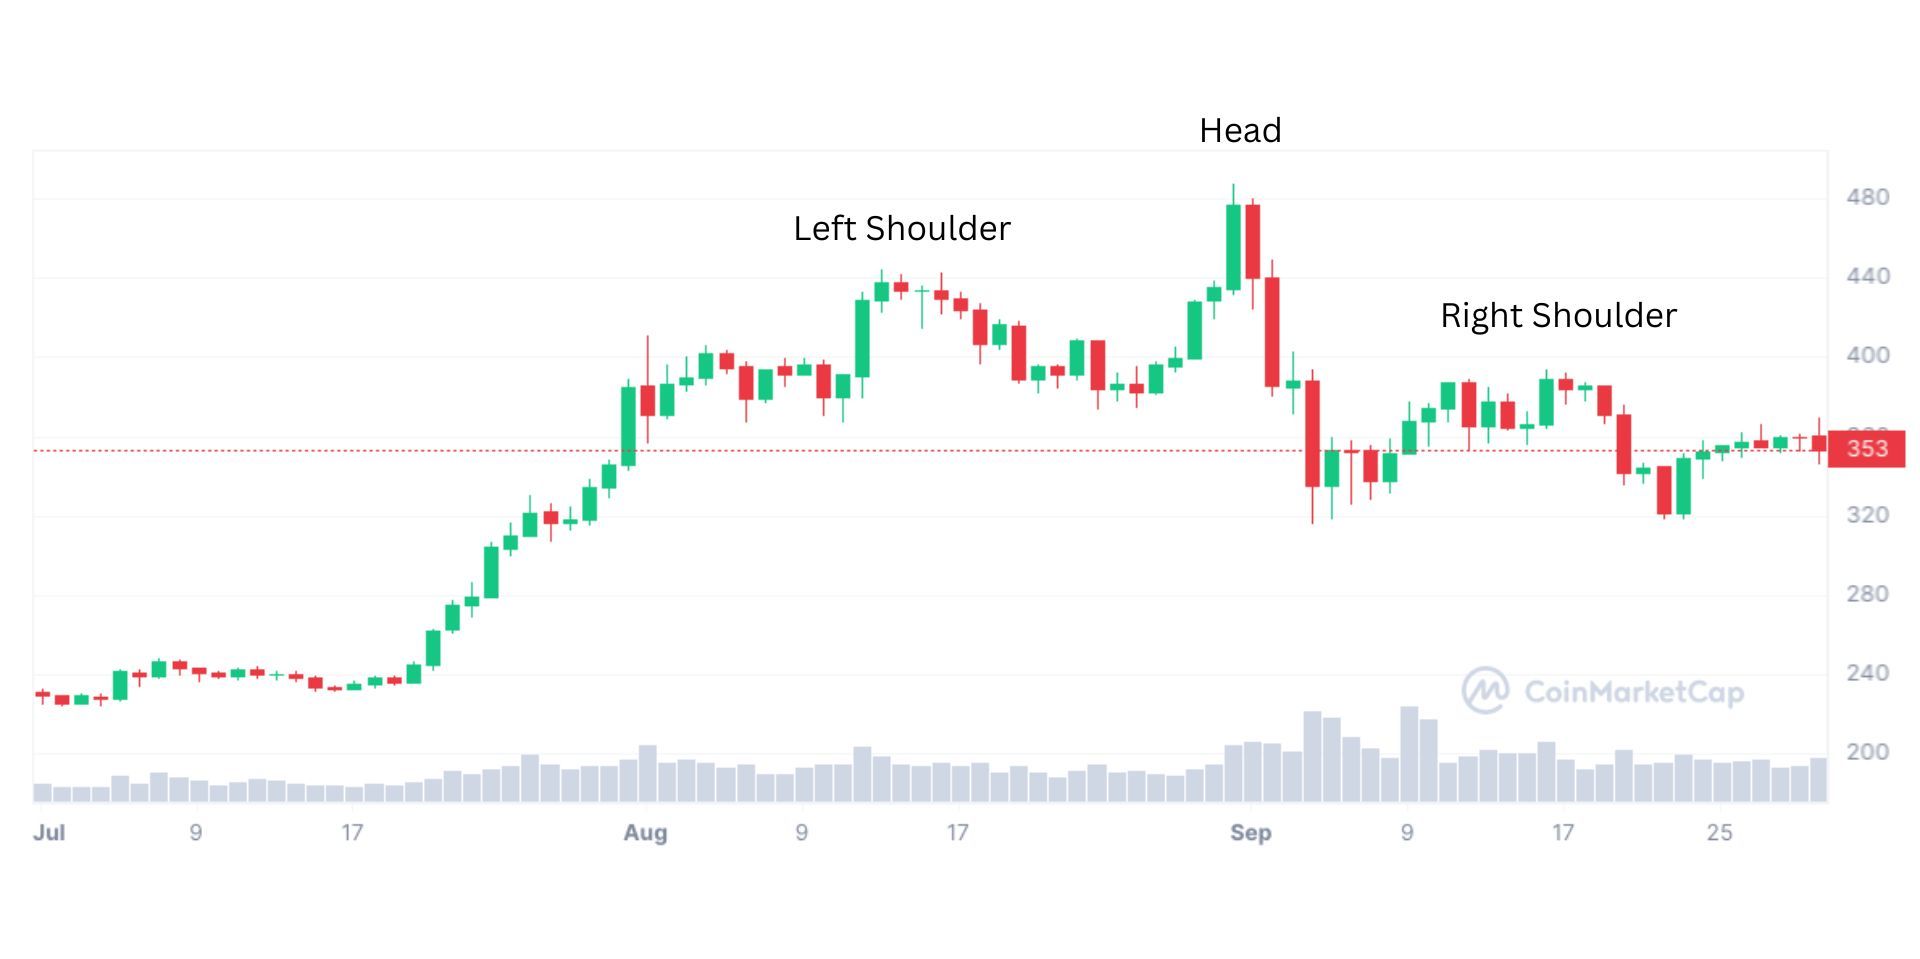
A typical crypto trend reversal model is known as the Head & Shoulders pattern. Below is an example of a Head & Shoulders price change experienced by Ethereum.
On the left side of this pattern you have the left shoulder, followed by a small drop. Then the largest increase forms the head of the pattern. After this comes another dip, followed by a slight rise and dip, known as the right shoulder. Both the left and right shoulders do not reach the height of the head in this type of pattern.
This is a less obvious trend reversal, as it does not involve a steep rise followed by a steep decline (or vice versa). But regardless of the more gradual occurrence, it actually shows a trend reversal.
You can also get a reverse Head & Shoulders pattern, which essentially looks like the opposite of the pattern shown above. In this case, you get a small drop in price, followed by a small increase (which forms the left shoulder), and then a significant drop in price. After this, the price recovers a little (forms the head), falls less severely than before, then recovers (forms the right shoulder). The Head & Shoulders pattern can be either bearish or bullish.
A Sushi Roll is another common type of trend reversal – a sideways movement of candlestick bars (showing no significant changes) is followed by a large up or down tick (ie a series of red or green bars). Like the Head & Shoulders pattern, a Sushi Roll can be either bearish or bullish.
So, crypto trend reversals can come in different forms, but can you spot them before they occur?
Can you spot a trend reversal before it happens?
Sometimes no one sees a price increase or a price drop coming. So you can’t see any warning signs of a trend reversal, right?
Not exactly. Before a trend reversal starts, there is a short window that indicates the upcoming change. You need to know how to read crypto price charts, especially candlestick charts, to spot an impending trend reversal.
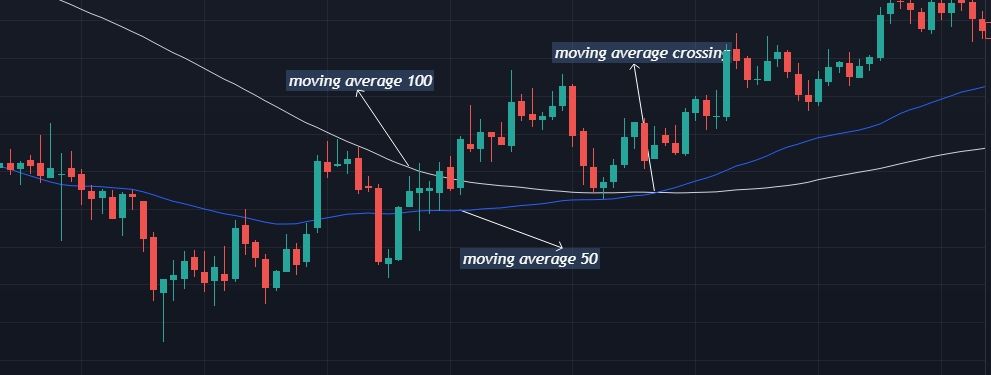
Various factors, including moving averages and volume indicators, can indicate an upcoming trend reversal.
Moving averages represent the most recent closing prices for a cryptocurrency. Crypto traders often use one of two moving averages, one spanning 50 days and the other spanning 200 days. A shift in an asset’s moving average may indicate that a trend reversal is imminent.
On top of this, volume indicators can also come in handy. These refer to an asset’s trading volume, which represents how much of it has been traded in the last day, week, month, etc. 24-hour trading volumes are the most commonly used and can indicate upcoming trend reversals. If an asset’s trading volume sees a sharp rise or fall, a trend reversal may be on the way for that asset’s price.
Crypto trend reversals can cause major ripples in the market
Crypto trend reversals can be small, but have also historically caused significant changes to the entire market. Such reversals can be good or bad news for investors, so if you have a crypto holding or want to buy, make sure you know how trend reversals work and what to look for to identify their approach.
