Quant explains how US stock market volumes affect Bitcoin price
A quant has explained how there is a correlation between the latest trends in the US stock market volumes and the Bitcoin price.
The TradFi Depth Oscillator has hit a low and is now turning up again
As explained by an analyst in a CryptoQuant post, the depth of volume in traditional financial markets has been low recently.
“TradFi Volume” is a measure of the total number of transactions that buyers and sellers make in the US stock market.
There is a concept called “market depth”, which is the ability of any market to take in large orders without affecting the price of the commodity much.
Generally, the more orders there are in a market, or simply, the higher the volume, the stronger the depth of the asset. Something important, however, is that these orders should be spread evenly in the market, otherwise the depth would not be as great.
By using an oscillator, the cyclical trend in the depth of any asset can be felt. Here is a chart showing how the US stock market volume depth oscillator has changed its values over the past few months:
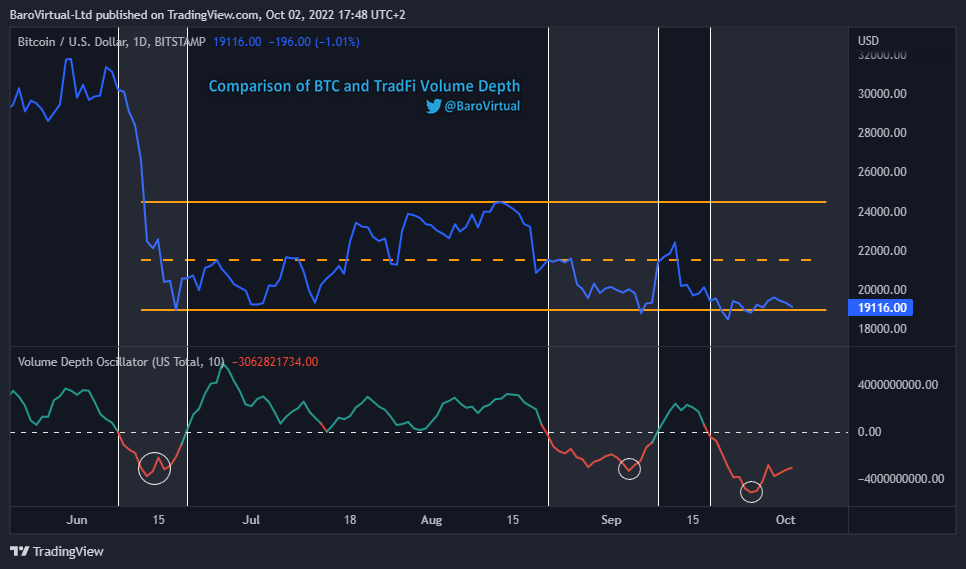
The value of the metric seems to have been turning around in recent days | Source: CryptoQuant
As you can see in the graph above, the quant has marked the relevant trend zones between the Bitcoin price and the TradFi Volume Depth Oscillator.
It seems that when the indicator has crossed from positive to negative values, the cryptocurrency has observed bearish winds.
On the other hand, the metric crossing the zero line in the opposite direction has led to a bullish trend for the price of BTC.
Bitcoin has also seen local bottom formations around the points where the stock market volume depth oscillator itself has hit lows.
About a week ago, the indicator hit very low values comparable to those between February and March 2020. Since then, the metric has started to turn up again.
The analyst believes that this recent trend formation could mean that Bitcoin could get a breather soon, bouncing to levels between $21.5k to $24.5k.
Bitcoin price
At the time of writing, Bitcoin’s price is hovering around $19.2k, up 2% in the last seven days. Over the past month, the crypto has lost 4% in value.
The chart below shows the trend in the price of the coin over the last five days.

Looks like the value of the crypto has been stuck in consolidation during the past few days | Source: BTCUSD on TradingView
Featured image from Traxer on Unsplash.com, charts from TradingView.com, CryptoQuant.com


