On-Chain Data Reveals Bitcoin (BTC) Price Could Bottom Anytime Soon
It looks like the cryptocurrency market will continue its bearish moves this weekend as the world’s number one cryptocurrency, Bitcoin, is still hovering around $19,000 price levels. At the time of reporting, Bitcoin is trading at $19,741 with a fall of 0.24% in the last 24 hours.
Meanwhile, to know Bitcoin’s bottom, there are two main on-chain indicators that one needs to look at, realized price and MVRV ratio.
First, the realized price indicator is the one that the average cost of Bitcoin delivers for a day that each currency last traded in the chain. This calculation is considered one of the important indicators that help to know the market’s cost base.
On the other hand, the MVRV ratio is what calculates the ratio of the Bitcoin supply’s market value along with its realized value. Through this ratio, Bitcoin’s current trade is positioned above or below fair value, and this calculation is used to understand net market profitability.
When the spot price of Bitcoin trades below the realized price, the MVRV ratio will definitely trade below 1. This suggests that investors and traders are holding their holdings below the cost basis and unrealized loss.
Then, when the MVRV has a consistent movement, there is a formation of support, and when this is considered together with realized price, it can signal a bottom.
It has been observed that even during previous bear markets, the Bitcoin price has plunged below the 200-week moving average realized price. Also since 2011, this trade below the realized price has been seen for 180 days, but in March 2020 the decline was only for 7 days.
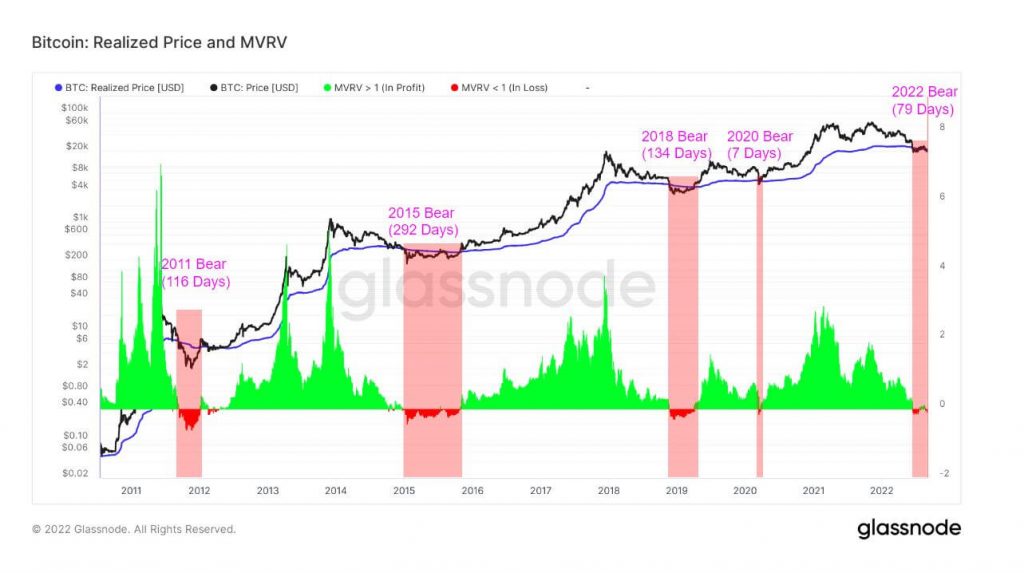
It has now been 79 days for the Bitcoin price placed below the MVRV ratio since Terra collapsed in May. Although the BTC price saw a leg up above the MVRV ratio in August, it is still not the right time to say that Bitcoin’s bottom has found its end.
Bitcoin Price To Surpass $20,000 Range?
This shows that $20,000 is the strong resistance area and this area suggests market strength and how low the price may fall in the coming days.
The Glassnode data suggests that in August, Bitcoin saw a significant jump in its relative unrealized losses after a surge in early summer. When there is an increase in unrealized loss score, it refers that the addresses are still holding on to their investments amid their relative devaluation.
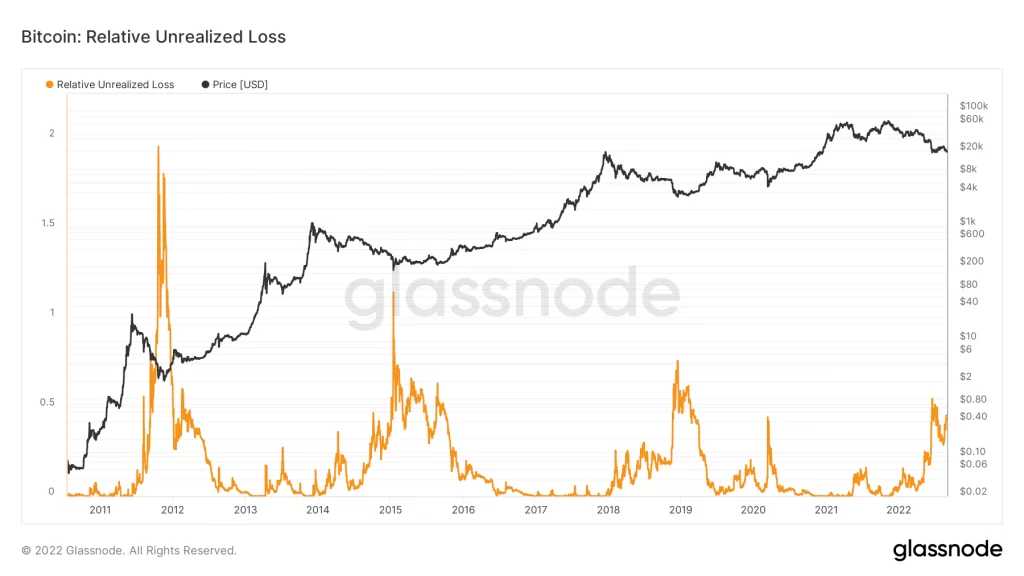
According to previous statistics, whenever unrealized relative losses have increased, Bitcoin showed higher lows. In the very next cycle, Bitcoin made a move towards the high it last hit before the bearish cycle, but failed.


