How will the price of Bitcoin (BTC) go this month?
Bitcoin (BTC) has had a strong start to 2023, climbing 43%, its strongest rally in two years. But since the beginning of February, the price has remained unchanged. Since testing resistance at $24,000, BTC fell 4% to hit a seven-day low of $22,700. But how will the market react and how long will this correction last?
BeInCrypto looks at On-chain Network Activity, Exchange Flows and Miner’s Reserves to analyze the potential of Bitcoin support/resistance points in the coming weeks.
Bitcoin network activity shows low interest from major investors.
The number of Bitcoin whale transactions has taken a downturn since February 2, coinciding with a 4% correction from $23,800.

Bitcoin network activity data compiled by Santiment showed that on January 4, transactions over $100,000 on the Bitcoin network reached a 2023 peak of 12,069. But a month later, whale transaction volume had fallen below 8,000 daily.
The trend has largely been due to increased negative perception around BTC and growing interest in critical altcoin sectors. Altcoins native to blockchain-based artificials like SingularityNET have been the biggest winners this year. At the same time, the whale interest in proof-of-stake networks such as Cardano (ADA) and Polygon(MATIC) has also contributed to the diminishing dominance of Bitcoin.
Another critical metric that has set the pace for recent flat performance is the increasing selling pressure from whales with 100 to 1000 BTC balances. Historically, this group of holders’ wallet balances have been highly correlated to the price of BTC.
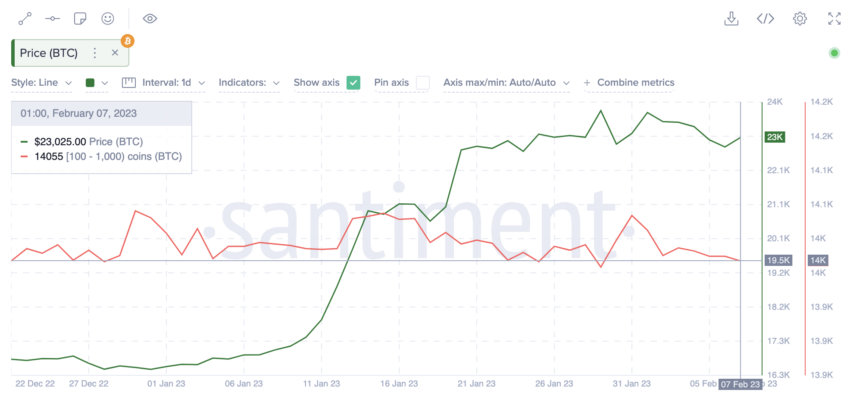
Recently, as highlighted by Santiment, whalers in the range of 100 to 1000 BTC have been increasingly selling off their tokens. Although marginal, this could be a strong indicator that Bitcoin is likely to remain below $23,000 in the coming week.

In/Out of the Money Around Price (IOMAP) is a metric that monitors Bitcoin wallet addresses approaching the break-even point. Historically, holders tend to sell out their tokens when BTC approaches its average purchase price.
IntoTheBlock’s IOMAP data indicates that BTC midpoint support at around the $22,500 point is significantly weaker than the resistance cluster at $23,500. This means that BTC looks set to fall to $22,500 in the coming week.
Considering the large wall of supply around the $23,300 point, if BTC breaks below $22,800, it could lead to a more significant price drop as the cluster of holders try to cut their losses.
Exchange net flows and wallet addresses approaching the break-even point show that Bitcoin may fall below $22,000 again.
The net flow of Bitcoin across top exchanges is another metric flashing a mildly bearish signal in February. Exchange-netflow compares the rate BTC is deposited on exchanges with withdrawals.
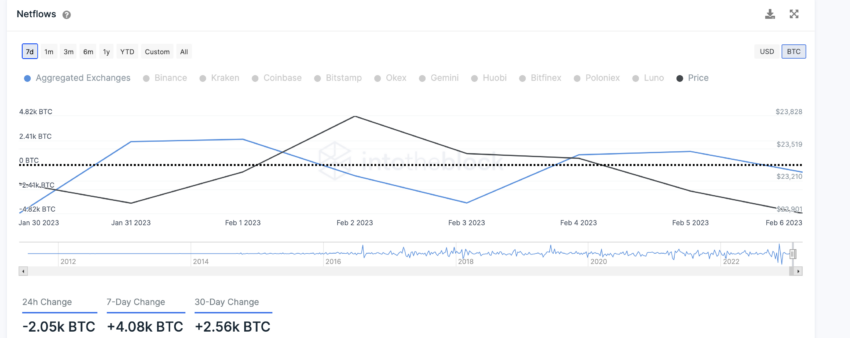
IntoTheBlock data shows that Bitcoin supply on exchanges has increased by around 4,080 BTC in the past seven days. This represents a 60% increase over the 30-day net change. Historically, when exchanges receive more deposits, BTC holders may be looking to increase selling pressure in the coming days.
Generally, a positive exchange netflow value indicates that more Bitcoin holders may be looking to sell off their tokens in the coming days.
Mining costs have fallen – but enough to drive a BTC price rally?
In more optimistic terms, Bitcoin mining costs have dropped significantly over the past seven days. And many top miners are left in a net-positive position.

The BTC price is currently above the average cost of mining a block, according to data presented by Cambridge-affiliated platform MacroMicro. Historically, miners have been observed to accumulate block rewards in their reserves when prices are higher than operating costs.
The miners’ reserve trends will significantly affect the prices of Bitcoin in the coming days. Even amid the waning BTC dominance and growing negative sentiment, if mining costs stay below $22,000, BTC could witness another price rally in February.
Keeping an eye on FB
Bitcoin sparked the current crypto rally on January 12 after the US Federal Reserve published the CPI report for December. The report showed that inflation on household goods has slowed by 0.1% compared to the previous month. Leads to the Fed reducing its interest rate increase in January.
The next CPI report is scheduled to be published on 14 February. If inflation falls again, BTC could be set for another rally as central banks look set to cut interest rate hikes for the second month in a row.
Disclaimer
BeInCrypto strives to provide accurate and up-to-date information, but it will not be responsible for missing facts or inaccurate information. You comply and understand that you should use this information at your own risk. Cryptocurrencies are highly volatile financial assets, so do your research and make your own financial decisions.


