How to Use Bollinger Bands to Buy and Sell Bitcoin

There are many possible applications for using Bollinger Bands to decide whether to buy or sell Bitcoin.
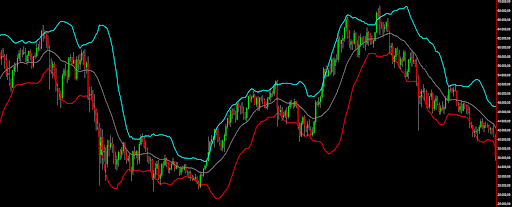
This indicator is named directly after its inventor John Bollingerwhich analyzed the behavior of prices by moving away from or approaching moving averages.
To do this, Bollinger thoughtfully inserted two bands, calculated as the standard deviation of the simple average of prices, and tried to find a way to enclose and contain prices within well-defined bands.

How Bollinger Bands work
The two bands, upper and lower, can become the input “trigger” for a trading strategy: an exit of prices from the bands identifies an outbreak of volatility, so prices should either continue to run in the direction they have taken or reverse their predetermined course and make a reversal, if an exit from the bands is followed by a sudden re-entry into them.
It is a well-known fact that Bitcoin, i.e. the leading cryptocurrency by market cap, tends to stay in the trend for quite some time before reversing course. Based on this construction, the Bollinger Bands should be used in trend follower mode. Therefore, it will be necessary to wait for a price exit from the upper band to enter long orders, and an exit from the lower band to enter short.
When trading with an indicator, the time frame to choose will also be extremely important. Therefore, there is an urgent need for a comparison of the most used time frames, in order to perform an optimization that identifies the best results.
How to Use Bollinger Bands to Buy Bitcoin
Setting as the backtest window the years from August 2017 to the present day, i.e. the data provided by Binance for spot Bitcoin, the results obtained are very different from each other. The fixed size used is $10,000 per trade.
The time frames chosen vary from 15 minutes to daily.
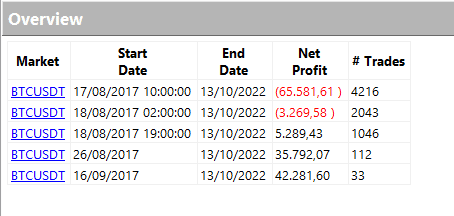
In Figure 2, it can be seen that as the time frame increases, the Bollinger Bands signals are more effective. In fact, the best cases are achieved with time frames of 480 minutes (4 hours) and 1440 minutes (daily bars).

In descending order: 15 minutes, 30 minutes, 60 minutes, 480 minutes, 1440 minutes
The 15-minute time frame, i.e. the first on the list, loses systematically, an indication that perhaps the faster the time frame, the more it will be the case to operate with a mean rollback strategy, as opposed to trend following. It is a different matter for time frames from 60 minutes to 1440 minutes (ie the last 3 in the list in Figure 2) where positive results are noted.
At this point, a spontaneous focus arises on the best time frame in so many ways, the 480-minute time frame, which in the historical period under consideration gives a very good profit, with a respectable average trade. The statistical sample, or more simply the number of trades, is also higher than the daily time frame, amounting to only 33 trades in the historical period.
Therefore, 480 minutes is chosen as the reference time frame, and stop-loss and take-profit are added which can protect the account somewhat against excessive moves.
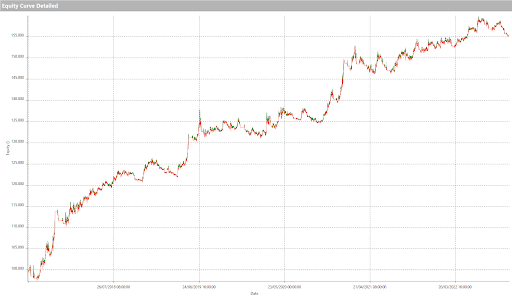
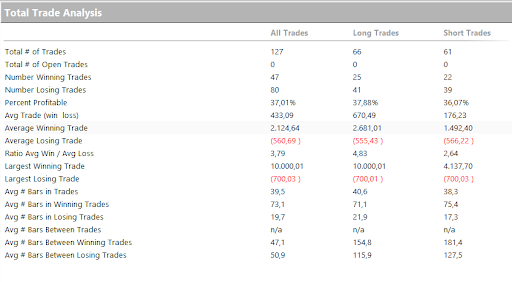
With the stop-loss set at $700 (equal to a 7% increase in position value) and a very ambitious take-profit (target) of $10,000, this produces the results visible in Figures 3 and 4.


The profit curve is upward sloping and the average trade exceeds $400, which is a very good 4% price excursion on the position’s counter value.
Make predictions about Bitcoin
In conclusion, we have seen how Bollinger bands can also be applied to Bitcoinas they are able to identify, on the most appropriate time frames, starting points of market trends that can be used as entry triggers for devising trading strategies.
However, there is still some doubt about the stability of the results, since as the time frame changed, the profit obtained by the system was variable, to say the least. While it is undeniable that the moves became more airtight as the time frame narrowed, it is considered appropriate to test the strategy by running it on out-of-sample data in order to fully evaluate it.


