ETH Drops to 5-Day Low as Fed Likely to Delay Policy Pivot – Market Updates Bitcoin News


Ethereum fell to its lowest level since last Friday during today’s session, as the consolidation in the crypto markets continued on Wednesday. This comes ahead of this afternoon’s US central bank’s interest rate decision. Bitcoin was also in the red, and is still below $20,800.
Bitcoin
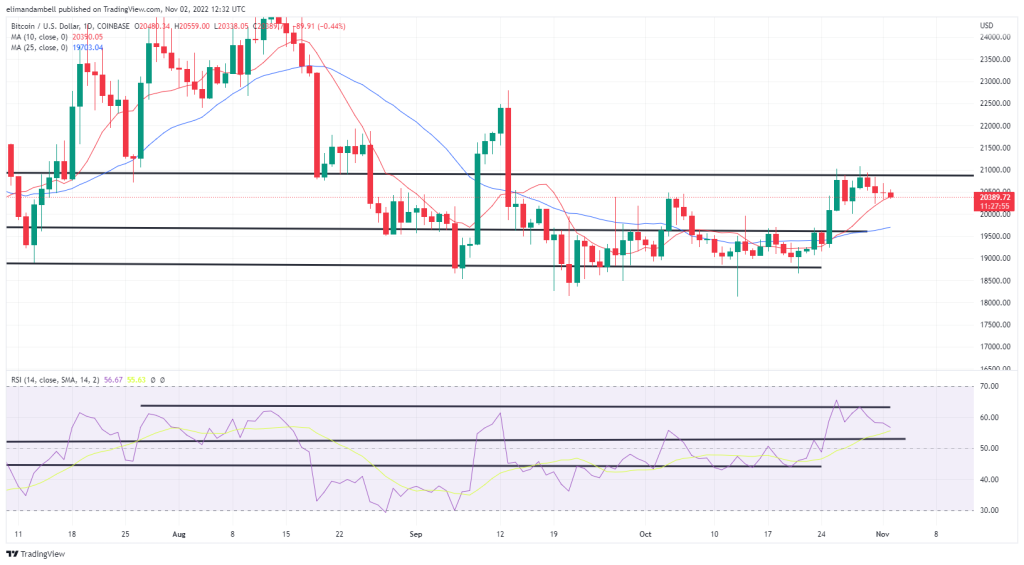
Bitcoin (BTC) continued to trade below $20,800 on Wednesday as market uncertainty remains high ahead of this afternoon’s Fed meeting.
Although markets have somewhat priced in a 75 basis point increase, some are also looking for forward guidance from the bank, which includes a timeline for pivoting policy.
BTC/USD fell to a low of $20,359.85 earlier in today’s session, less than 24 hours after tracking at a high of $20,545.35.

Looking at the chart, the token has mostly been trading in the red since the weekend, which comes after a failed breakout on the Relative Strength Index (RSI).
The index failed to move beyond a long-term ceiling of 63.00 over the weekend, which served as a signal for the bears to re-enter the fold.
This afternoon’s decision is likely to either add to this bearish pressure, or act as a green light for bulls to once again control sentiment.
Ethereum
Like bitcoin, ethereum (ETH) has largely declined to start the week, with the token also falling to five-day lows.
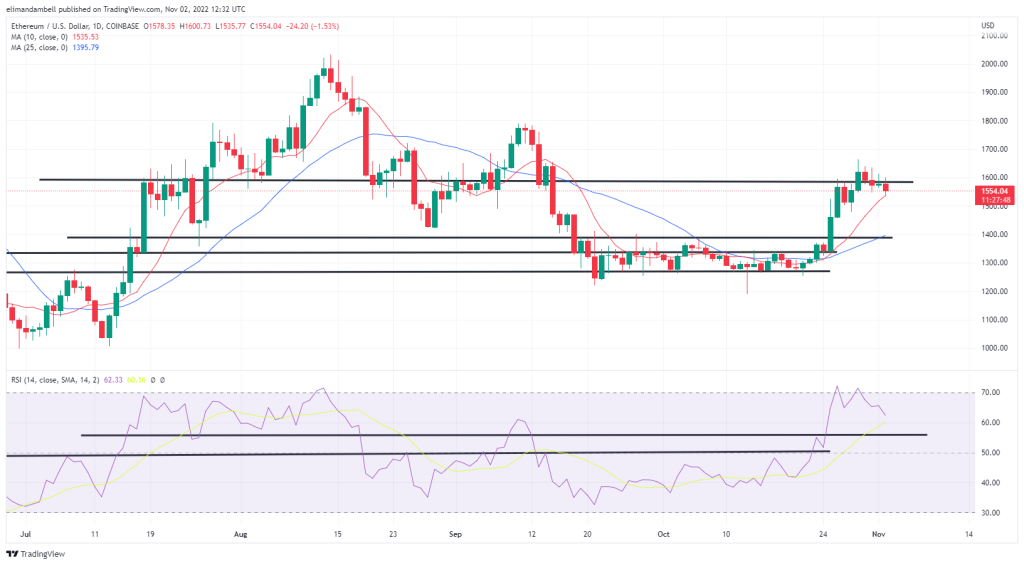
After a high of $1,595.78 in yesterday’s session, ETH/USD fell to an intraday low of $1,544.08.
As a result of this latest move, Ethereum remains below the key resistance level of $1,585, which it breached for the first time in over a month last week.

At the time of writing, the 14-day RSI is currently tracking at 62.74, which is down from yesterday’s high of 66.71, and below a floor of 65.00.
This decline in price strength highlights the gradual slowing of momentum, with the 10-day (red) moving average likely to begin to reverse direction, should the pullbacks persist.
The next visible support point for the index appears to be the 60.35 level, and should this be breached, sentiment would have really changed.
Register your email here to get weekly price analysis updates delivered to your inbox:
Could we see markets continue to consolidate themselves after the Fed decision? Leave your thoughts in the comments below.
Image credit: Shutterstock, Pixabay, Wiki Commons
Disclaimer: This article is for informational purposes only. It is not a direct offer or solicitation of an offer to buy or sell, or an endorsement or recommendation of products, services or companies. Bitcoin.com does not provide investment, tax, legal or accounting advice. Neither the company nor the author is responsible, directly or indirectly, for any damage or loss caused or alleged to be caused by or in connection with the use of or reliance on content, goods or services mentioned in this article.


