ETH Drops Below $1,600 As Prices Extend Recent Decline – Market Updates Bitcoin News


Ethereum again traded in the red, as prices of the token fell below $1,600 during today’s session. Tuesday’s drop marks the fifth day in a row that prices of the cryptocurrency have moved lower. Bitcoin also extended its streak of declines, falling below $23,000 in the process.
Bitcoin
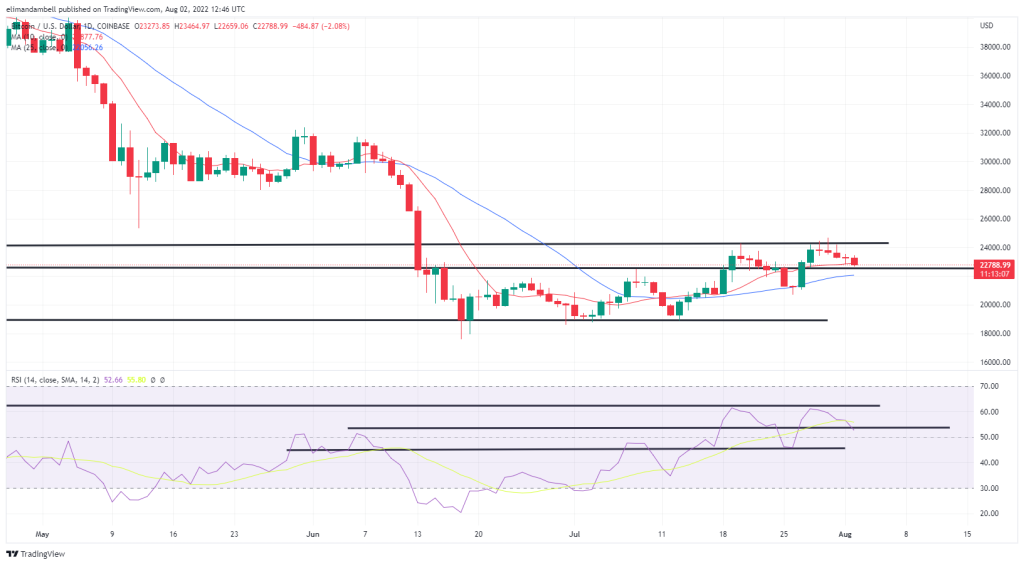
Bitcoin (BTC) was lower for a fifth day in a row, as prices of the token fell below $23,000 in today’s session.
After peaking at $24,121.64 to start the week, the world’s largest cryptocurrency plunged over $1,000 on Tuesday.
This latest decline saw BTC/USD hit a low of $22,710.08 earlier in the day as prices neared a key support level.

BTC is fast approaching a floor of $22,500, which has historically been a place where previous bearish periods were significantly exacerbated.
As can be seen from the chart, the last time this floor was breached on July 25, bearish pressure increased to the downside, moving prices from that point to a low of $20,737, all within a 24-hour period.
Today’s drop comes as the 14-day relative strength index (RSI) fell below its own floor at the 53 level, currently trailing 52.70.
Ethereum
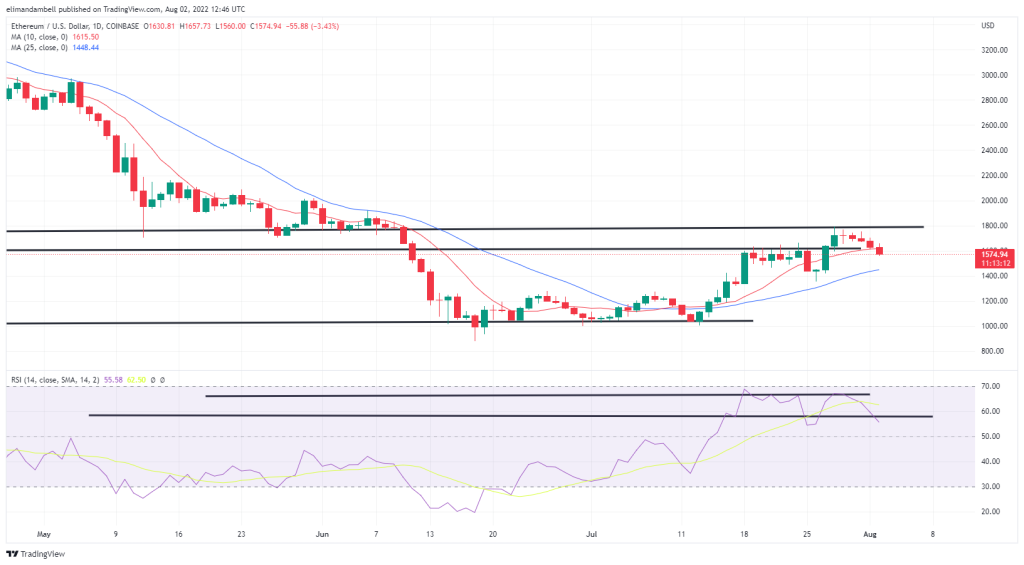
Tuesday also saw ethereum (ETH) extend its recent downtrend for a fifth consecutive day, with the token falling below $1,600 in the process.
ETH/USD moved to an intraday low of $1,567.85 during today’s trade as bears pushed prices below a support point.
This was at the $1,620 floor tested on Monday, but on that occasion bulls managed to sustain the level, again pushing the price to a high of $1,685.59.

Since then, pressure has increased and, like bitcoin, the 14-day RSI has moved below a separate support point.
At the time of writing, the relative strength index is at 55.55, following a recent breakout of a floor at 58.
The target appears to be a new support at 54.20. Should this be hit, we could see ETH trading around $1500.
Register your email here to get weekly price analysis updates delivered to your inbox:
What do you think is causing this latest downtrend in crypto? Leave your thoughts in the comments below.
Image credit: Shutterstock, Pixabay, Wiki Commons
Disclaimer: This article is for informational purposes only. It is not a direct offer or solicitation of an offer to buy or sell, or an endorsement or recommendation of products, services or companies. Bitcoin.com does not provide investment, tax, legal or accounting advice. Neither the company nor the author is responsible, directly or indirectly, for any damage or loss caused or alleged to be caused by or in connection with the use of or reliance on content, goods or services mentioned in this article.


