Decline for bitcoin ahead? Bearish crossover forms in this metric
The Bitcoin taker buy/sell ratio is currently forming a crossover which has seen the price of the asset observe a decline in the past.
Bitcoin Taker Buy Sell Ratio Moving Average Crosses Over
As pointed out by an analyst in a CryptoQuant post, the 350-day moving average (MA) of the metric is crossing with the 100-day exponential moving average (EMA) right now. The “Taker Buy/Sell Ratio” is an indicator that measures the ratio of taker-buy and taker-sell volumes in the Bitcoin futures market.
When the value of this metric is greater than 1, it means that the long or taker buying volume is higher than the short or taker selling volume at the moment. Such a trend suggests that more users are willing to pay a higher price for BTC right now.
On the other hand, values below the threshold suggest that the receiver’s selling volumes are more dominant in the futures market at the moment, thus a bearish sentiment is shared by the majority.
Now, here’s a chart showing the trend of the 350-day MA and 100-day EMA versions of the Bitcoin taker-buy/sell ratio over the past few years:
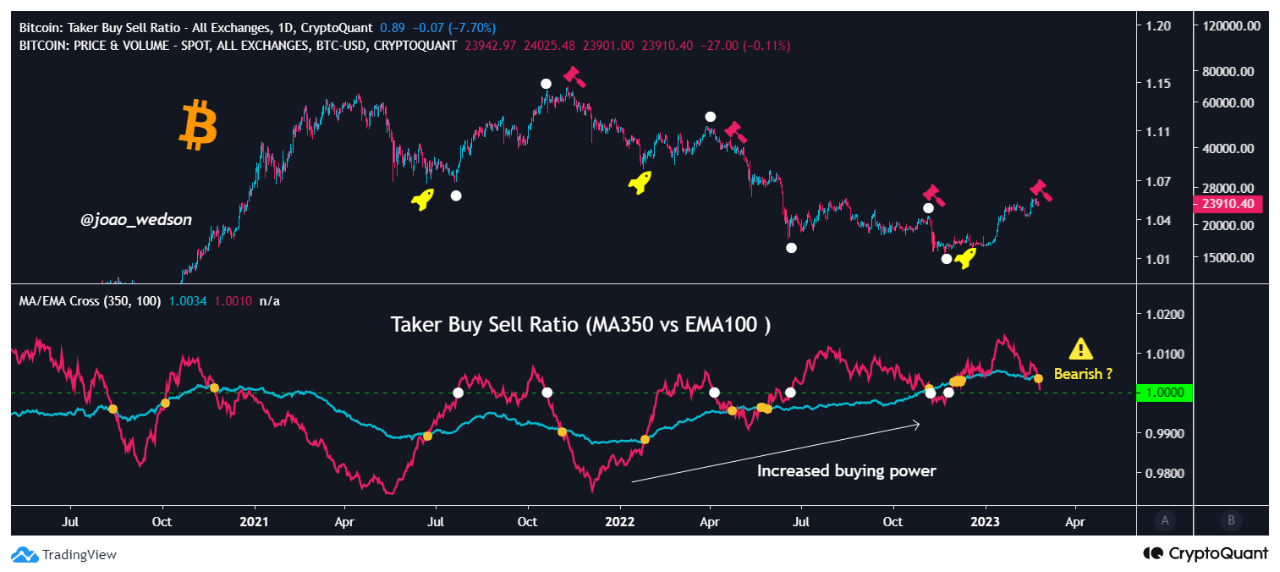

Looks like the two metrics have come together in recent days | Source: CryptoQuant
As you can see in the graph above, the quant has highlighted how the behavior of these two moving averages of the user’s buy/sell ratio appears to have affected the price of the cryptocurrency.
It seems that every time the two metrics have crossed, the BTC price has observed a buy or sell signal. More specifically, whenever the 100-day EMA has crossed below the 350-day MA, the price has felt a bearish effect, while the reverse type of crossover has generally been bullish for the coin.
A peculiar trend that has historically been seen with the 100-day EMA is that when this indicator breaks the 1 line, BTC price forms a bottom (when the break is over) or top (when it is below).
Recently, these Bitcoin taker buy/sell ratio lines have touched each other again. The bearish type of crossover seems to be forming here, as the 100-day EMA has dipped below the 350-day MA.
If the previous instances of this crossover are anything to go by, BTC may soon see some downside. The price has actually already dropped a bit in the last few days, but for now it is unclear if the crossover is already in effect or if the real drop is yet to come.
The 100-day EMA taker buy/sell ratio also appears to be plunging recently, and the metric is now rapidly approaching the 1 level. If a break below takes place, a local top could be confirmed for the price, if, again, the previous pattern has any relevance.
BTC price
At the time of writing, Bitcoin is trading around $23,900, up 1% in the past week.


BTC seems to have declined in the last few days | Source: BTCUSD on TradingView
Featured image from Mark Basarab at Unsplash.com, Charts from TradingView.com, CryptoQuant.com


