Bullish or bearish? Analyzing Bitcoin Price with Elliott Wave
The application of the Elliott Wave principle can provide valuable insight into the future price action of Bitcoin, by examining and counting past wave patterns.
Each wave has unique corresponding market behavior that helps shed light on where the top cryptocurrency is in the market cycle. And according to this new analysis, that’s not where most people think. Check out the video or read more below
Understanding the Elliott Wave Principle in Bitcoin
The Elliott Wave principle is a technical analysis tool that seeks to identify repetitive patterns in the financial markets. It divides price movements into waves, each of which represents a particular phase of market behavior. These waves follow a predefined structure and provide clues about market sentiment and potential price targets.
In the context of Bitcoin, the Elliott Wave Principle suggests a particular progression of waves and corresponding market behavior. Wave 1 marks the first pullback from undervalued levels, indicating the recognition of Bitcoin’s potential.
Wave 2 represents a retest of previous lows without establishing a new low, suggesting continued negative sentiment. The absence of a new low in wave 2 often leads to increased participation in wave 3, which tends to be the longest and strongest wave. Positive news cycles and growing fundamentals support the upward momentum of wave 3.
Wave 4 signals the end of the growth phase, characterized by profit-taking activities. It is generally seen as a disappointing wave as valuations fall short of investors’ expectations despite the enthusiasm witnessed during wave 3.
Wave 5 represents the final advance, accompanied by improved performance and fundamentals. However, it usually falls short of reaching the same strength as wave 3. Wave 5 is often driven by psychological factors, such as fear of missing out (FOMO), which leads to excessive overestimation.
Based on the above descriptions alone, what wave does it sound like Bitcoin is in?


Bitcoin fits the channeling technique in the diagram | BTCUSD on TradingView.com
What the current wave count suggests
In the video and chart above, the channeling technique shown can project a possible wave 5 target. Given the current bearish sentiment and the significant number of investors who believe the Bitcoin cycle has ended, wave 5 of the current cycle could witness an unprecedented emotional surge, contributing to significant overvaluation.
Claims that the Bitcoin cycle is already complete based on premature assessments of the market tops are refuted by the Elliott Wave principle. The projected top of the channel derived from connecting the parallel lines of waves 2 and 4 indicates that the end of wave 5 did not match these expectations.
Furthermore, the chart below explains the correct wave counts for two different types of corrections. Waves 2 and 4 often have “alternation”, where a correction is typically a sharp zig-zag, or a sideways triangle or flat correction.
A zig-zag shows a lower high, while flat corrections have a higher high, much like the second 2021 BTCUSD “top”. This once again points to a wave 4 correlation and wave 5 ahead.


Alternating styles of corrections in crypto | BTCUSD on TradingView.com
The latest advancement and beyond
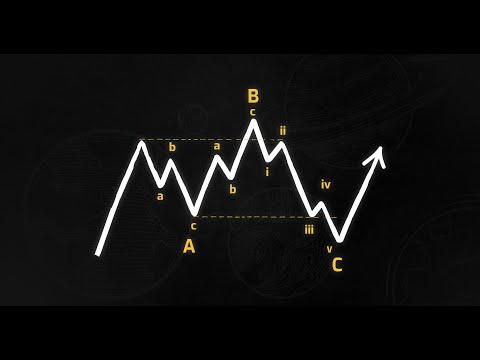
So what happens after the latest advance? Bear markets and corrective waves within the Elliott Wave principle are usually composed of three waves, labeled as ABC.
These corrective waves aim to balance the preceding impulse waves. The closing point of a correction is expected to fall within the range of the previous wave 3 and 4, providing a potential price range for Bitcoin’s correction phase.
The final chart below shows where along wave 5 and the final progress Bitcoin is now. According to the Elliott Wave principle, larger waves divide into smaller degree waves. Therefore, it is crucial to identify the completion of the current lower timeframe correction before making any predictions about future price movements.
The lower degree subwaves suggest that wave (2) of 5 is underway. Similar to a major magnitude wave 2, investors expect more downside and the bearish corrective phase to continue. When a lower low is not made, everyone piles into wave (3). This indicates that there may be a lot of upside left in Bitcoin after an extended downtrend.


The final advance and beyond | BTCUSD on TradingView.com
Crypto cycle conclusion
Understanding the development of waves and their corresponding market behavior enables investors to make more informed decisions. A correct wave count can indicate that Bitcoin is entering its final advance, or possibly well into it.
Unfortunately, a more significant bearish swing in crypto is inevitable. It is therefore important to be patient and wait for confirmation before drawing definitive conclusions. But before that happens, BTCUSD could surprise the market to the upside as long as there is no new low. Watch the video for the full explanation.
If the psychology and the technical structure fit, so long#Bitcoin pic.twitter.com/IQQRgJ9rpv
— Tony “The Bull” (@tonythebullBTC) 11 May 2023


