BTC, ETH, XRP, BNB, DOGE and ADA – Cryptopolitan


The weekly price analysis for today reveals that the entire market has traded in a mixed direction. While some of the cryptocurrencies are trading sideways, others have seen a big upside move. Throughout the week, the top coins have remained bounded between their upper and lower limits. Bitcoin has traded between $24,000 and $23,000, while Ethereum has held its price between $1,600 and 1.5500. Ripple’s XRP token was also trading in a similar range along with other top coins such as Binance Coin (BNB), Dogecoin (DOGE) and Cardano (ADA).
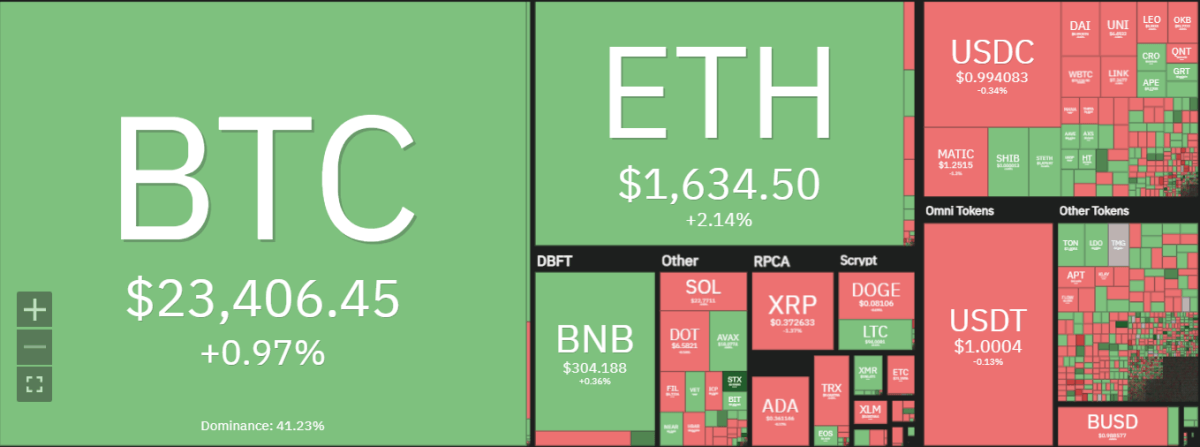
The altcoins market has also seen some big swings this week. Looking at the cryptocurrency price heatmap, most of the altcoin markets are experiencing decline, with only a few gaining ground in the Red Sea such as the NEO and LDO markets. The overall cryptocurrency market capitalization appears to be experiencing a market correction following recent bullish moves. It will be important to keep an eye on key support and resistance levels in the coming days to see if the market can bounce back or if it will continue to decline.
BTC/USD
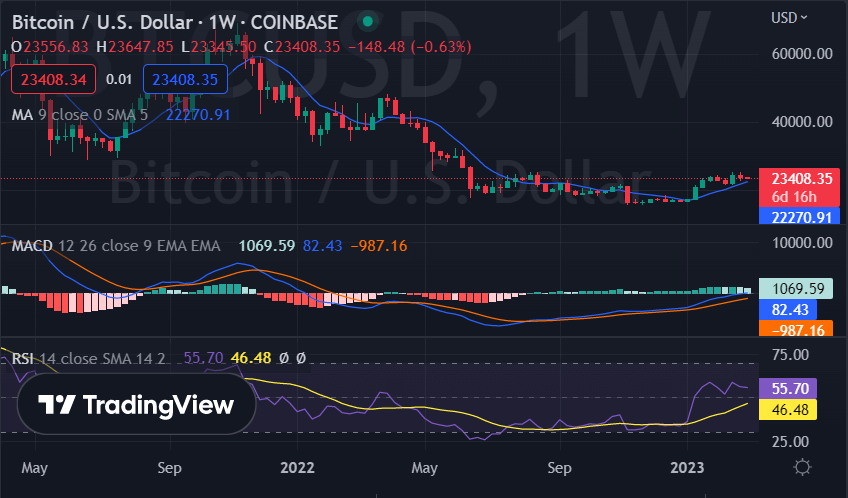
Bitcoin price analysis shows that the digital asset has been trading in a consolidation phase for the past week. After BTC’s recent surge above $24,000, bulls have lost momentum and the price has struggled to break through the $24k psychological barrier. If buyers manage to push Bitcoin’s price above this level, further upside can be expected in the coming days.
BTC/USD is currently trading at $23,442 and it is important to keep an eye on the key support levels at $23,137 and the resistance level at $23,654. The coin currently has a market cap of over $452 billion and a daily volume of more than $17 billion.

The weekly crypto price analysis shows that the technical indicators are currently giving mixed signals as the MACD is showing bearish momentum while the RSI is at a neutral level. As for the moving averages, they still show bearish movement at $22,270.
ETH/USD
Ethereum price analysis reveals that the coin has been trading in a narrow range between $1,600-$1,550 for the past week. ETH/USD is currently trading at around $1,636 with a loss of 3.35 percent in the past week. But today the market has seen a slight upswing with the coin now trading up by 1.36 percent in the last 24 hours.

Looking at the technical indicators, the MACD is showing bullish momentum, with the signal line crossing above the MACD line. The RSI is currently up, indicating that the market could potentially go either way. And for the ETH moving averages, the 50-day just crossed above the 200-day, showing a bullish move.
XRP/USD
Ripple price analysis shows that the digital asset has been trading in a range limit channel between $0.36-$0.37 for the past week. At press time, XRP/USD is trading at around $0.3762, with a loss of just 0.55 percent over the past 24 hours. Support levels for XRP/USD are at $0.3754 and resistance levels can be found at $0.3806.

The MACD indicator is also showing a bearish crossover, which could help push XRP/USD lower over the next week and could take it to $0.36 levels over the next few days. The RSI is currently at a neutral level, indicating that the market could go either way. As for the moving averages, they continue to show bearish movement with the 50-day crossing below the 200-day SMA line.
BNB/USD
Binance coin is among the digital assets that have tried to stay stable amid the cryptocurrency selloff. However, BNB prices have been relatively stable, with only a small drop in the last week. Currently, BNB/USD is trading at around $305.77 and has gained 0.29 percent in the last 24 hours.

Looking at the BNB/USD technical indicators, we can see that the MACD indicator is showing bullish momentum when the histogram widens and the signal line is above the MACD line. The RSI is also showing a bullish trend as it is currently at 51.61. The moving average is currently at $306.9 and still shows a bullish trend.
DOGE/USD
According to our weekly crypto price analysis, Dogecoin has been trading in a range between $0.080-$0.0082 for the past week and is currently trading at around $0.08134 with a gain of 0.26 percent in the last 24 hours. The coin has a market cap of more than $10 million and a daily volume of nearly $221 million.
Support levels for DOGE/USD are at $0.08098 and resistance levels can be found at $0.08247. And if we continue with the bullish momentum, the coin could potentially see a break above $0.083 in the coming days and a break below $0.08098 could take it to the $0.079 level.

Looking at the technical indicators, the moving average shows continued bullish movement with the 50-day SMA crossing above the 200-day SMA line. The moving average converges divergence (MACD) also shows bullish momentum, as the positive MACD line is above the negative one. The relative strength index (RSI) is currently at 47.68, indicating that the market could go either way.
ADA/USD
Cardano price analysis on the weekly chart shows that the price is trading in a range between $0.34 and $0.36 for the past week, with a current value of around $0.3629 at press time. The previous week, the bears and bulls were in a tug-of-war, resulting in no major price movements for the coin. Today, however, the coin has seen an increase of 0.32 percent over the past 24 hours.

The moving average lines also point to a bullish crossover and a breach of the critical support at $0.3676 could take the coin to $0.3698 levels in the coming days. The RSI indicator is currently at 44.59, suggesting that the pair may recover some of its recent losses in the near term. The MACD indicator is currently in positive territory, with the histogram extended and the signal line pointing upwards.
Weekly Crypto Price Analysis Conclusion
Overall, the cryptocurrency market remains in a mixed trend, with most of the major coins trading lower than their respective records. However, there are still some coins that have managed to stay relatively stable and have seen a small gain in prices. The indicators show that the markets can either go up or down in the near future. Therefore, it is important to be vigilant and look for any changes in price movements.


