BTC breathes altcoins hope amid bearish backdrop
- Bitcoin price is showing signs of exhaustion after a 20% rise in less than five days.
- Ethereum price turns the $1,730 barrier to support level in an attempt to fill the FVG at $1,820.
- Ripple price hits a ceiling of $0.357 and is likely to go back to $0.340 before attempting another leg.
The Bitcoin price has seen a massive increase in bullish momentum that has seen the spotlight shift from LUNA’s 350% run to BTC. Ethereum and Ripple have also rallied due to this rally and are currently consolidating to establish a new directional bias.
Bitcoin price to rediscover its next move
Bitcoin price has marked the $20,692 and $21,874 targets as mentioned in the previous publications. The main trigger for this move was a sweep of sell-side liquidity resting below the $19,511 support level.
As BTC hovers around $22,000, investors need to keep a close eye on the resistance barrier, which ranges from $22,850 to $23,000 and the imbalance, also known as the Fair Value Gap (FVG) at $23,164. A revisit to these levels could result in a local top formation.
The aftermath of this move would include a sell-off in the Bitcoin price to $18,497 and $17,570, which would be consistent with the bearish outlook from a macro perspective.
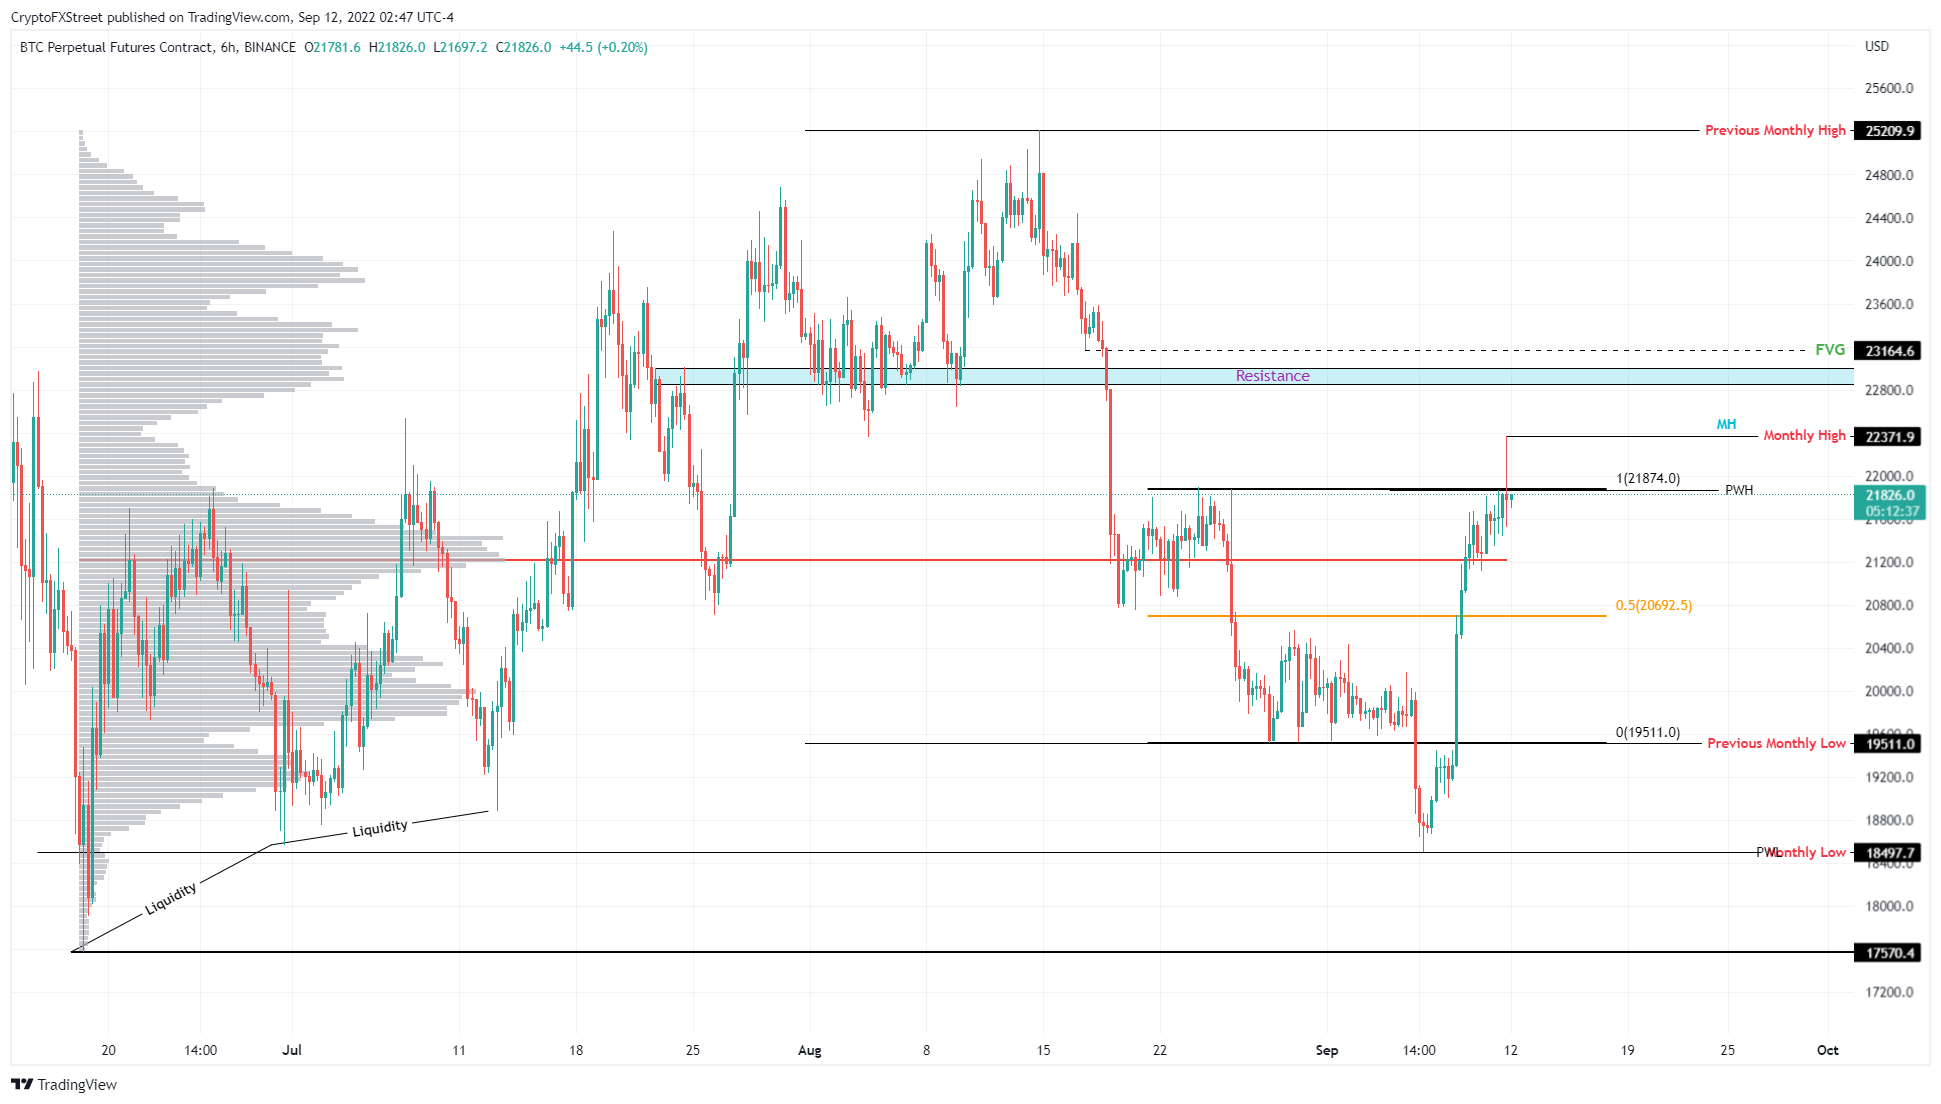
BTC/USD 6-hour chart
While things are looking up for the Bitcoin price, a reversal of the $25,000 barrier to a support level would invalidate the bearish thesis. This move would cause sideline buyers to step in and catalyze a run to $28,000.
The Ethereum price is waiting for an opportune moment
The Ethereum price rose 25% in the last 13 days – a higher return than Bitcoin. The advance pushed ETH to turn the $1,730 resistance level into a support floor as it tried to retest the imbalance at $1,820, known as FVG. After sellers took control, ETH fell back and retested the $1730 barrier and is now trying to break below it.
If successful, it could trigger an Ethereum price crash to $1,290, which is another stable support level. However, due to the consolidation and the volatility that comes with it, investors should consider the possibility that ETH disagrees with the market trend and visits the psychological level of $2,000 one more time before a move to $1,290.
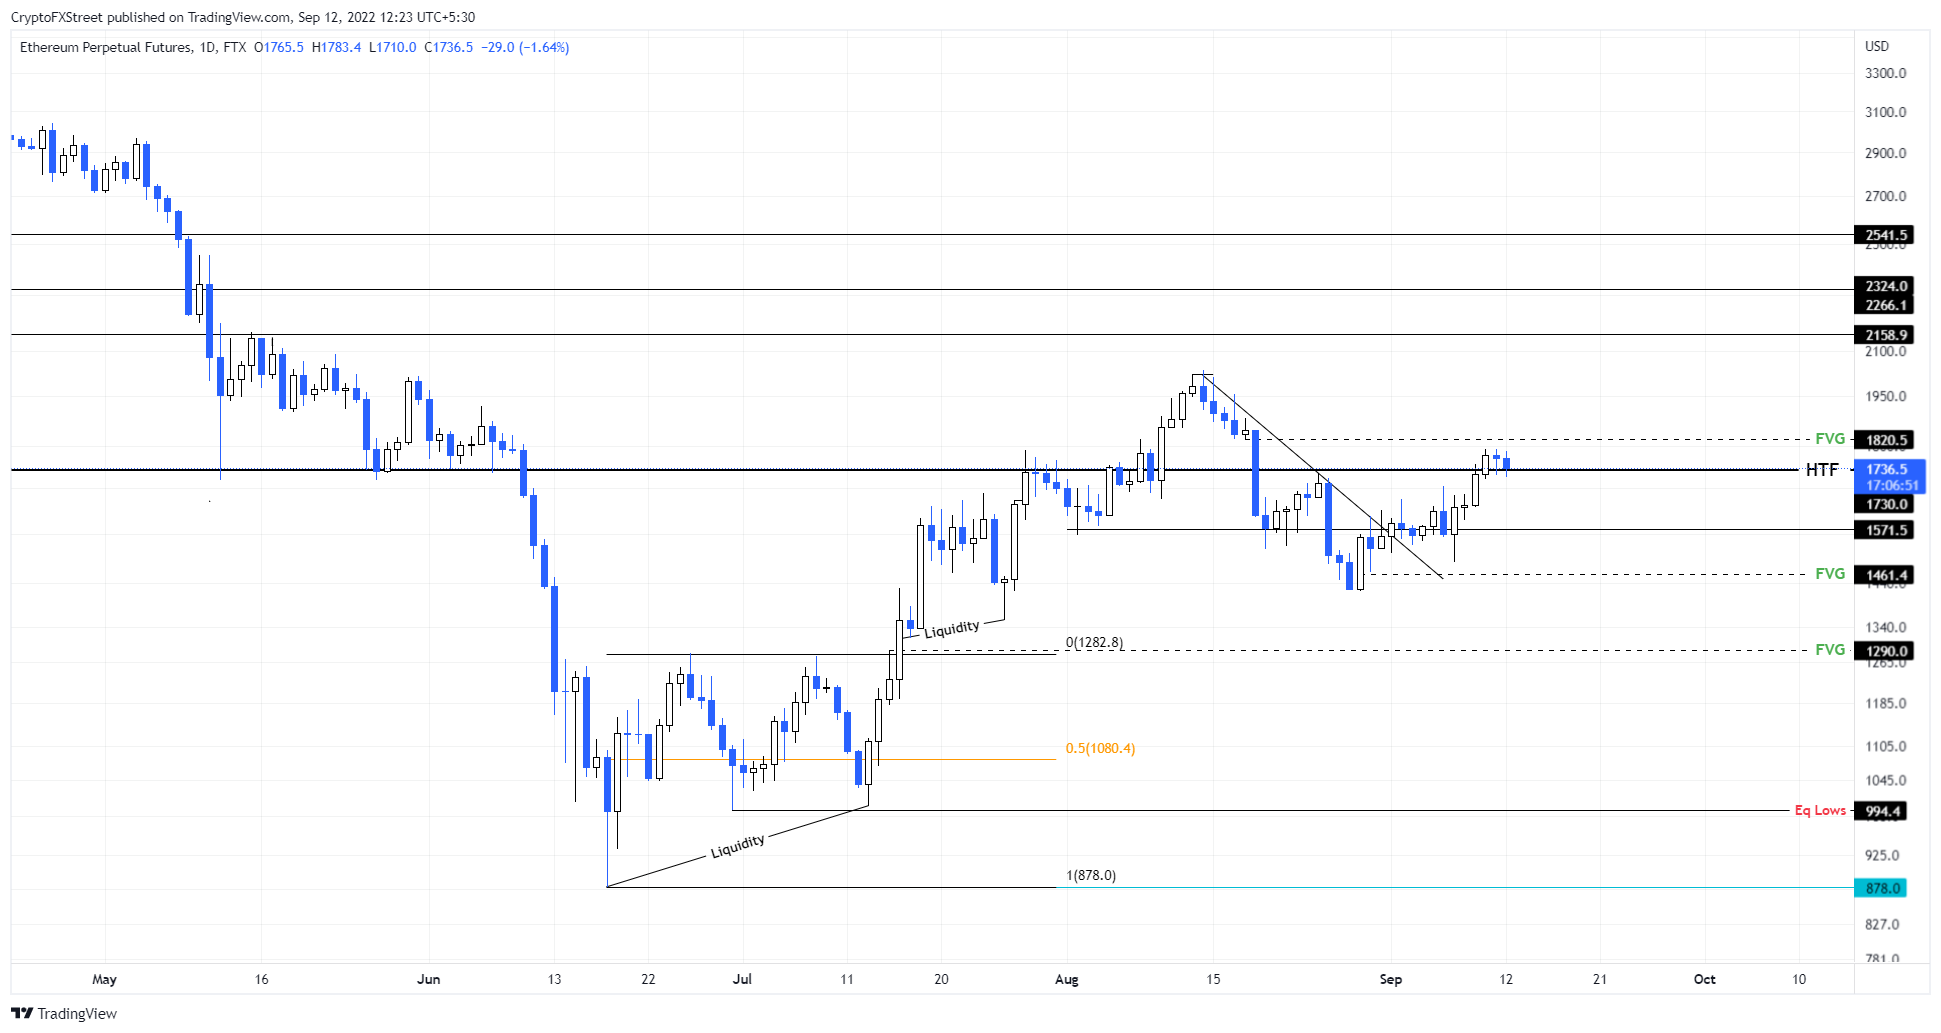
ETH/USD 1-Day Chart
While things are not looking too good for the Ethereum price, a daily candlestick close above $2,034 would create a higher high and invalidate the bearish thesis. This development could cause ETH to look back at the $2,200 and $2,500 hedges.
Ripple price ready to make a move
Ripple price rose 16% after sweeping the August 29 swing to a low of $0.318. This development was followed by a massive rally which is currently trying to overcome the resistance barrier at $0.360.
While reversal of this blockade will allow Ripple price to realize more gains, a failure could result in a pullback to $0.340. If buyers enter this level, they could catalyze another move to $0.381, which is another major resistance barrier.
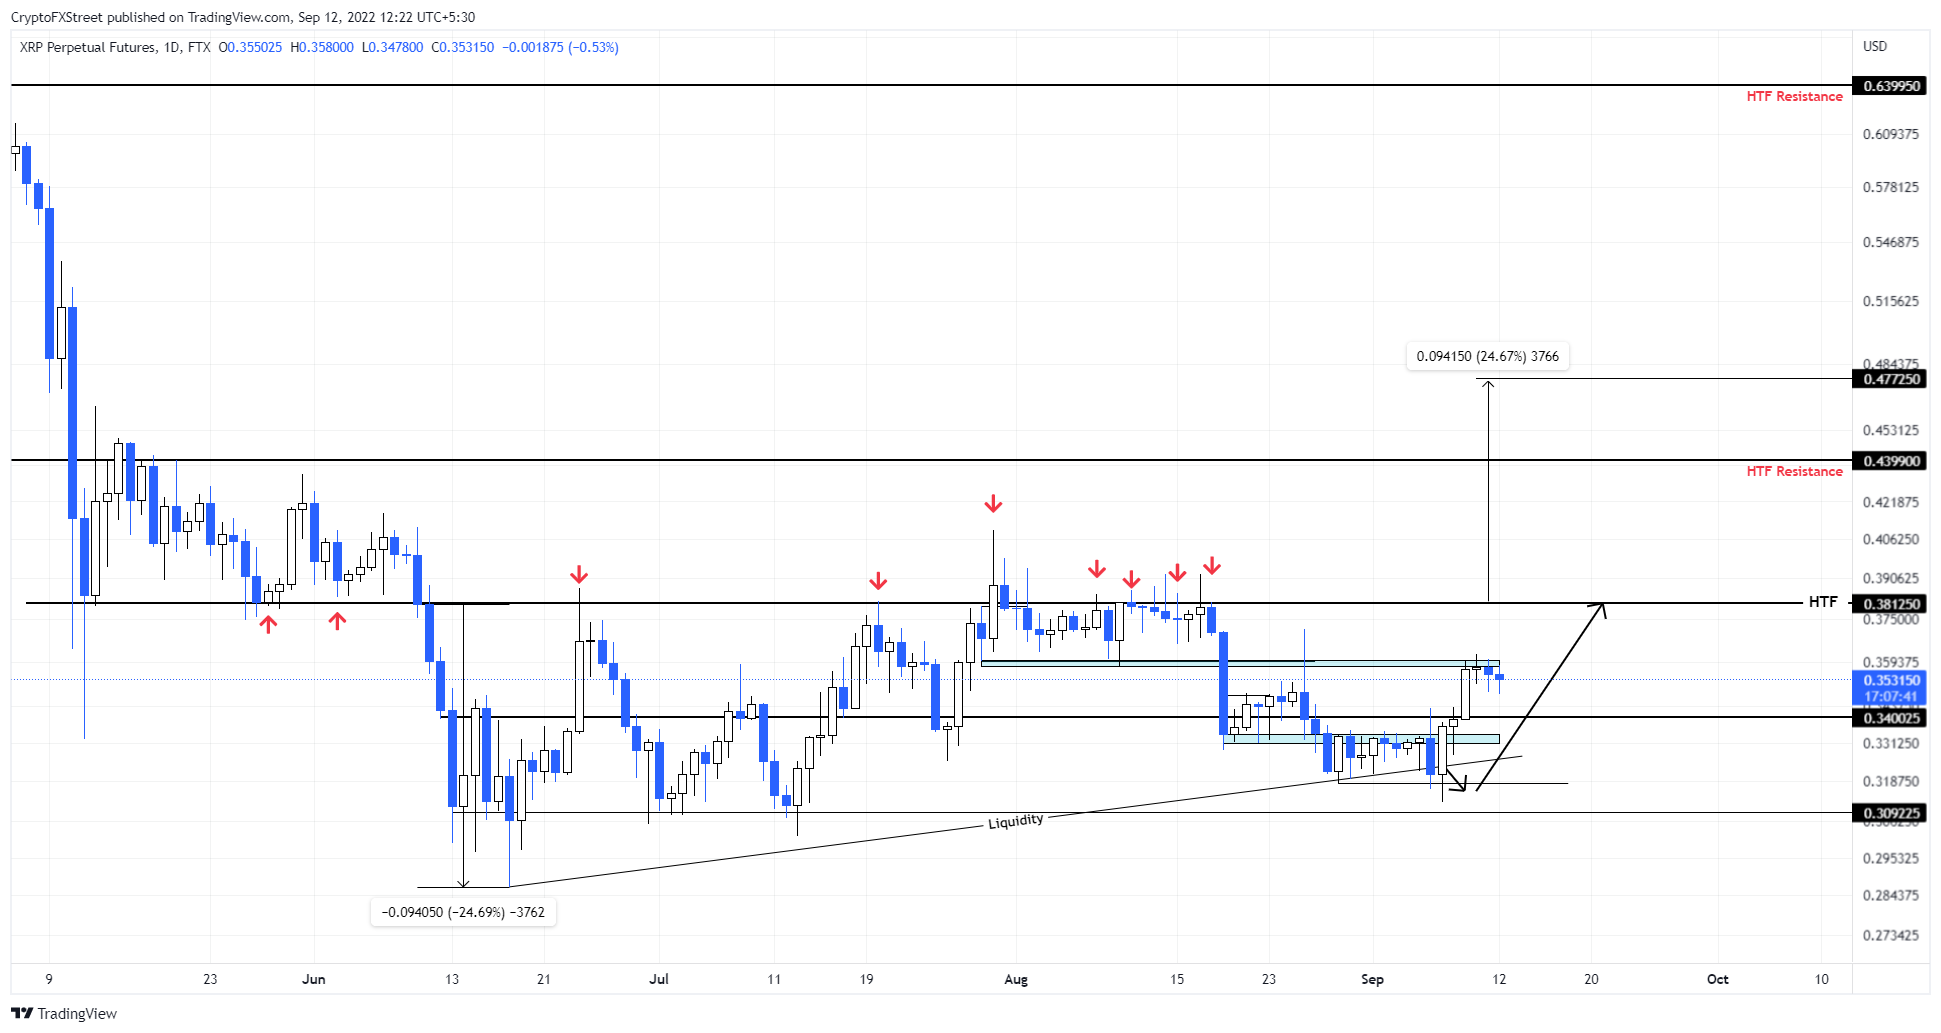
XRP/USD 1-Day Chart
However, a breakdown of the $0.309 support level will invalidate the bullish thesis for Ripple price. In such a case, market makers may lower the XRP price to gather the liquidity resting below the June 18 swing at $0.286.


