Bitcoin Taker Buy Sell Ratio Hits Highest Value in 636 Days
On-chain data shows that the buying ratio for Bitcoin takers has risen to a high not seen since nearly two years ago.
Bitcoin Taker Buy Sell Ratio Observes lift in recent days
As pointed out by an analyst in a CryptoQuant post, the buy ratio is now at its highest value in 636 days.
“Taker buy sell ratio”, as the name suggests, is an indicator that measures the relationship between taker buy volumes and taker sell volumes.
When the value of this metric is greater than one, it means that the long volume is overwhelming the short volume right now. Such a trend suggests that a bullish sentiment is more dominant in the market at present.
On the other hand, for the ratio to be below this threshold, it means that the recipient sales volume is currently higher. This trend naturally suggests that the market has a bearish majority sentiment.
Now, here’s a chart showing the trend in Bitcoin taker’s buy-sell ratio over the last couple of years:
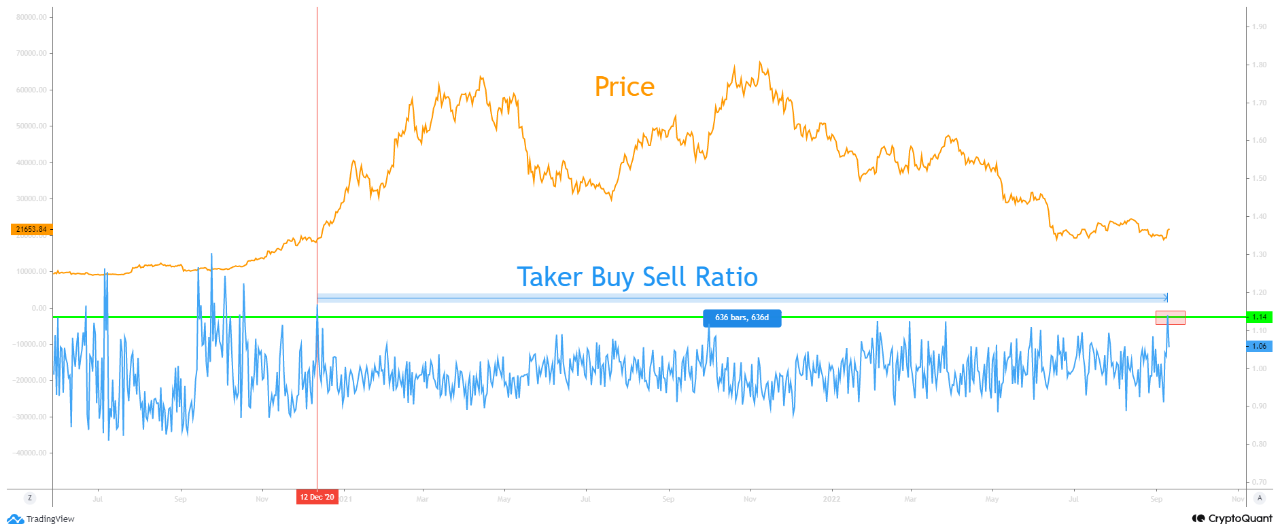
The value of the metric seems to have surged up in recent days | Source: CryptoQuant
As you can see in the graph above, the Bitcoin taker’s buy-sell ratio has seen an increase in value recently.
During this sudden surge, the indicator hit a high of 1.14, a value it has not seen since some 636 days ago.
Since these latter values are higher than the “1” mark, buyer volumes are currently more dominant in the market.
By the way, the last time these highs were seen was just before the 2021 bull run started. If a similar trend follows this time as well, the values of the current Bitcoin taker’s buy-sell ratio may turn out to be bullish for the crypto price.
BTC price
At the time of writing, Bitcoin’s price is hovering around $21.5k, up 9% in the last seven days. Over the past month, the crypto has lost 10% in value.
The chart below shows the trend in the price of the coin over the last five days.

Looks like the value of the crypto has observed upwards momentum during the past couple of days | Source: BTCUSD on TradingView
After plunging hard just two weeks ago, Bitcoin has seen a sharp recovery in recent days as the crypto has regained the $21k level.
For now, it is unclear if this recovery will last or if the coin will see a setback soon. However, as mentioned before, if the buyer’s buy-sell ratio is anything to go by, BTC could see a bullish outcome.
Featured image from Jievani Weerasinghe on Unsplash.com, charts from TradingView.com, CryptoQuant.com


