Bitcoin now undervalued for 170 days, how does this compare to previous bears?
On-chain data shows that Bitcoin has been undervalued for 170 days now, here’s how this number compares to that during the previous bear markets.
Bitcoin MVRV ratio has been stuck below ‘1’ since 170 days ago
As pointed out by an analyst in a CryptoQuant post, the lowest point the MVRV ratio has gone in this bear so far is 0.74.
The “MVRV ratio” is an indicator that measures the ratio of Bitcoin’s market cap to its realized cap.
Here the “realized cap” is a BTC capitalization model where each circulating coin’s value is taken as the price it was last moved/sold at. All these values are then summed for the entire supply to get a value of BTC.
This is in contrast to regular market value, where all coins are given the same value as the current Bitcoin price. The utility of the realized rate is that it acts as a kind of “real value” for the crypto, as it takes into account the cost basis of each owner in the market.
Thus, a comparison between the two caps (which is what the MVRV ratio is) can tell us whether the current BTC price is undervalued or overvalued right now.
The chart below shows the trend of the Bitcoin MVRV ratio over the past few years:
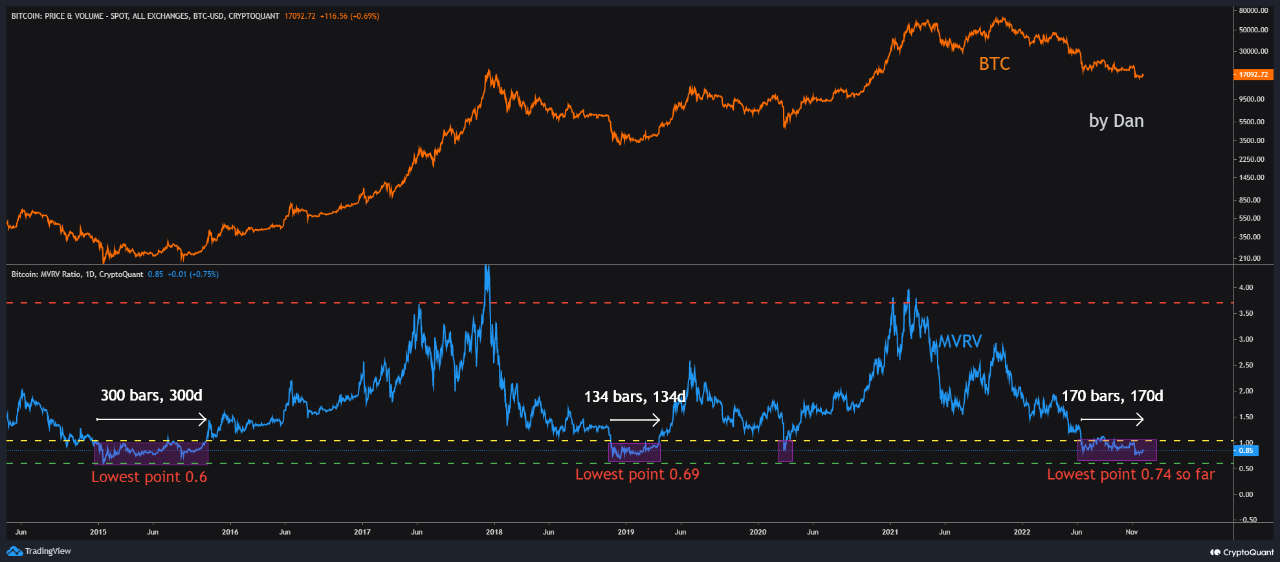
The value of the metric seems to have been below one in recent days | Source: CryptoQuant
As you can see in the graph above, the Bitcoin MVRV ratio has been below a value of 1 over the past few months, which means that the market cap has been below the realized limit.
Historically, the region below 1 is where bearish bottoms in the price of the crypto have been observed. On the other hand, the ratio is greater than 3.7 when peaks have been seen.
In the 2014-15 bear market, the indicator assumed values lower than 1 for 300 days, falling to as low as 0.6 during this streak.
However, the 2018-19 bear had a shorter cycle, as it was in this zone for only 134 days. The lowest point, 0.69, was also not as deep as in 2014-15.
In the current Bitcoin cycle, the metric has spent 170 days in this region so far, registering a low of 0.74.
The MVRV ratio has therefore now been longer in this region than during the last cycle, but it is still nowhere near the length seen in 2014-15.
The depth of the metric is also not as much as in some of the cycles, so it is possible that the bear will go even deeper before Bitcoin finds the bottom of this cycle.
BTC price
At the time of writing, Bitcoin’s price is hovering around $17.2k, up 7% in the last week.

BTC has surged up | Source: BTCUSD on TradingView
Featured image from Maxim Hopman on Unsplash.com, charts from TradingView.com, CryptoQuant.com


")