Bitcoin HODL waves show that this cycle is exactly the same as any other

A look at a graph of Bitcoin’s (BTC) price performance over the past few months will show a seesaw chart, but with significantly more downs than ups.
While the current market cycle may seem different than the past, the HODL wave measurement shows that it is not much different from previous cycles.
The HODL wave metric is a chart that groups the Bitcoin supply in circulation into different age bands and the changes in those age bands over the years.
With the chart it is possible to see what each group of market participants is doing with their Bitcoin and identify which group is selling.
A look at Glassnode’s Bitcoin Realized Cap HODL wave chart as analyzed by CryptoSlate research reveals that short-term holders between 6 – 12 months usually buy the flagship asset during a bull run when the price is near the top or at the very top.
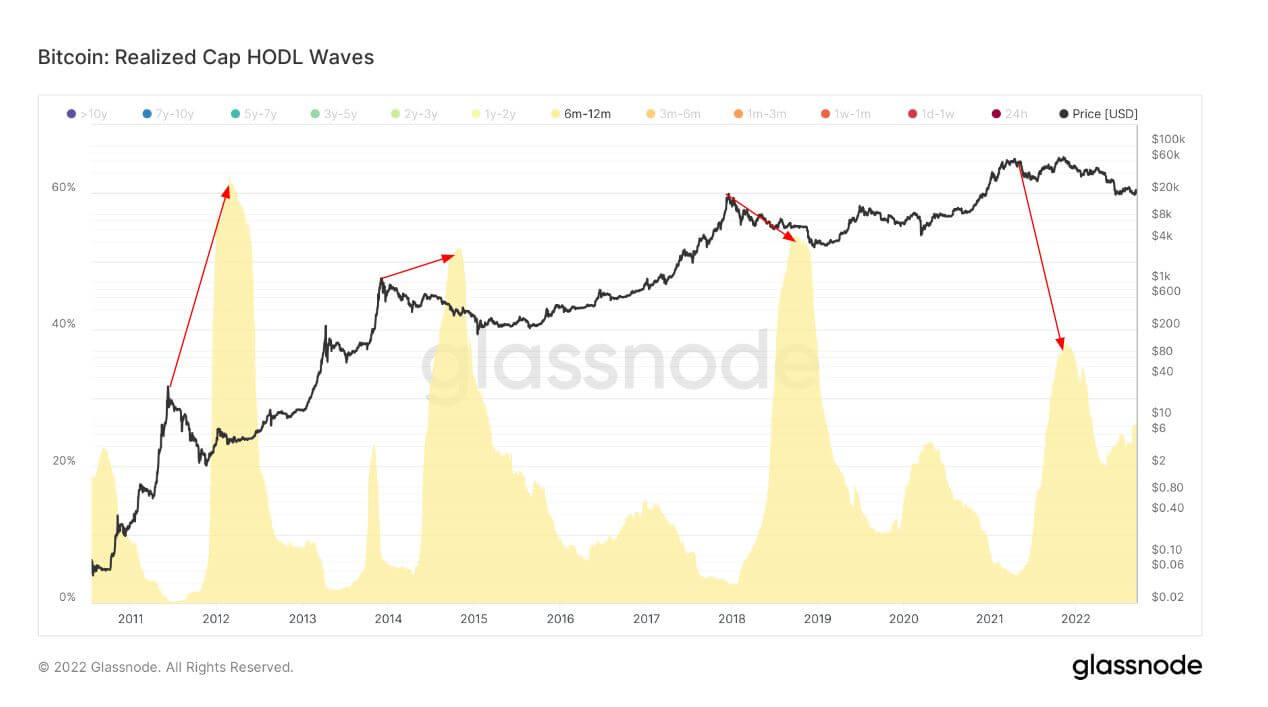
Most of these holders buy about six months after the market peaked – this is a graphic representation of the fear of missing out and this is when the HODL waves peak.
Usually, Bitcoin’s price drops soon after, leaving these short-term owners with unrealized losses.
Short-term owners buy means long-term owners sell to new market participants. This has played out in most market cycles, especially in 2013, 2017 and 2021.
However, the 1-2 year HODL wave has been different since 2021. Although the HODL wave also went down, showing that some sold during peak bull runs, the percentage was much lower.
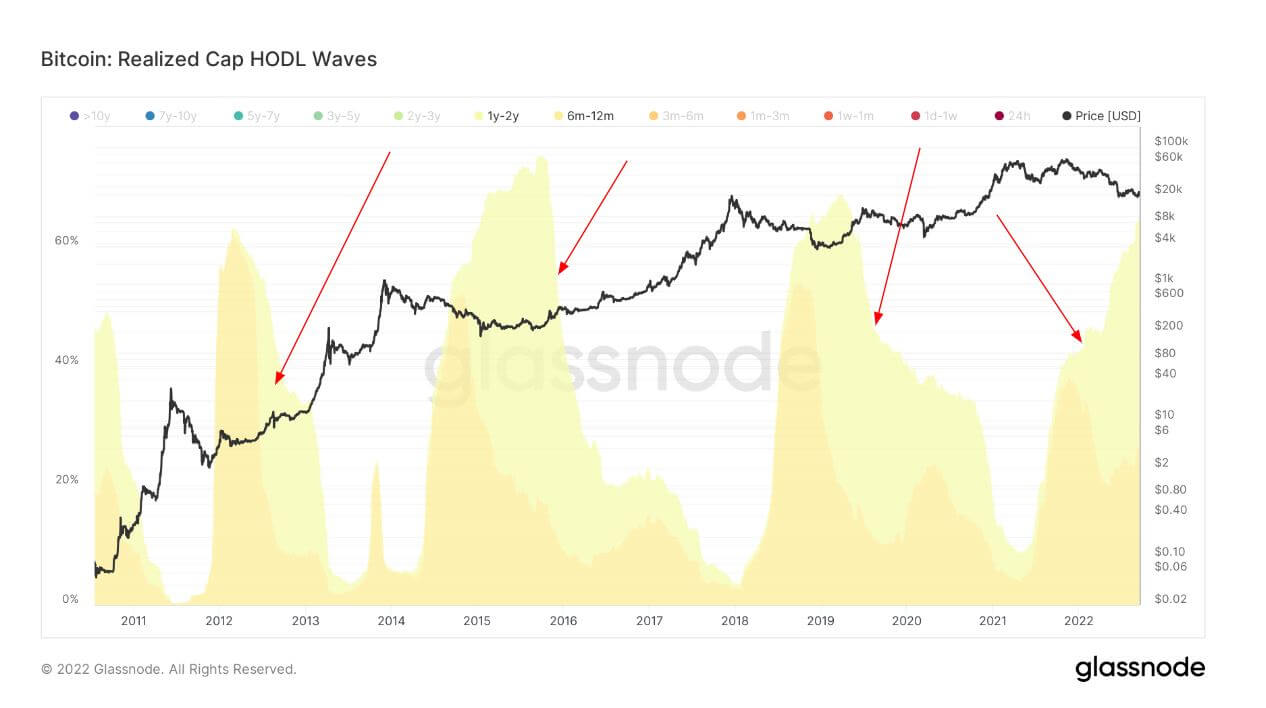
Although the price fell, about 60% of the supply remained. An explanation for this could be due to the conviction of long-term holders, or it could be due to being underwater since they bought at the peak when BTC was near its ATH.
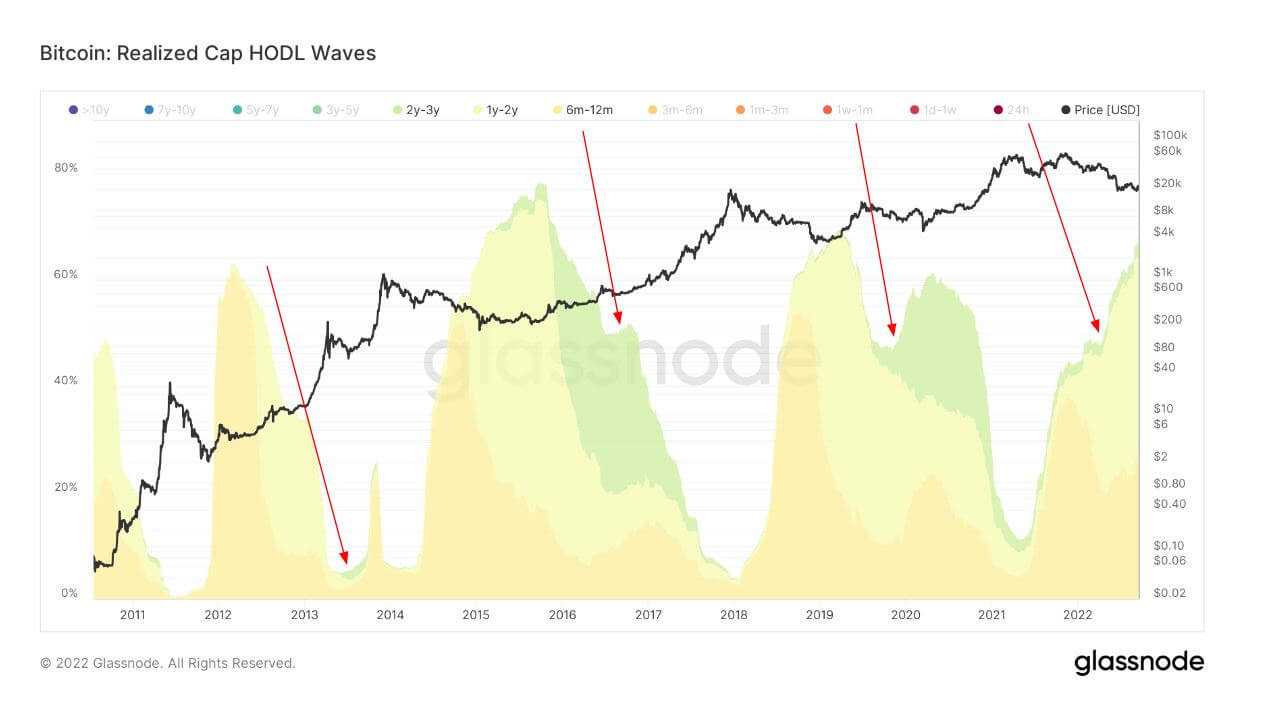
Meanwhile, 2-3 year owners make up a larger percentage of the inventory supply. However, this cycle is significantly smaller than the other two previous cycles. So we still have to wait for this group to mature as this will allow the network to become even stronger with people who bought the peak in 2021.
In conclusion, the HODL wave calculations show that this cycle is the same as others with no difference.


