Bitcoin Exchange Supply Hits Dec. 2017 Low, why this is good
On-chain data shows Bitcoin supply on exchanges has hit its lowest value since December 2017 as investors push towards self-storage.
Bitcoin supply on exchanges has dropped to 5.84% recently
According to data from the analysis company at the chain Sentiment, this latest plunge in the metric is a good sign of increased interest in self-storage among holders. The “supply of exchanges” is an indicator that measures the percentage of the total circulating supply of Bitcoin currently sitting in the wallets of all centralized exchanges.
When the value of this metric goes down, it means that the exchanges are observing the withdrawal of a net number of coins from the wallet right now. This type of trend, when prolonged, can be a sign that investors are accumulating the asset at the moment and can therefore be bullish for the cryptocurrency’s value.
On the other hand, an increase in the indicator’s value implies that the investors are depositing BTC to these platforms at the moment. As one of the main reasons holders may transfer to exchanges is for sales-related purposes, such a trend could have bearish implications for BTC’s price.
Now, here is a chart showing the trend of Bitcoin supply on exchanges over the last few years:

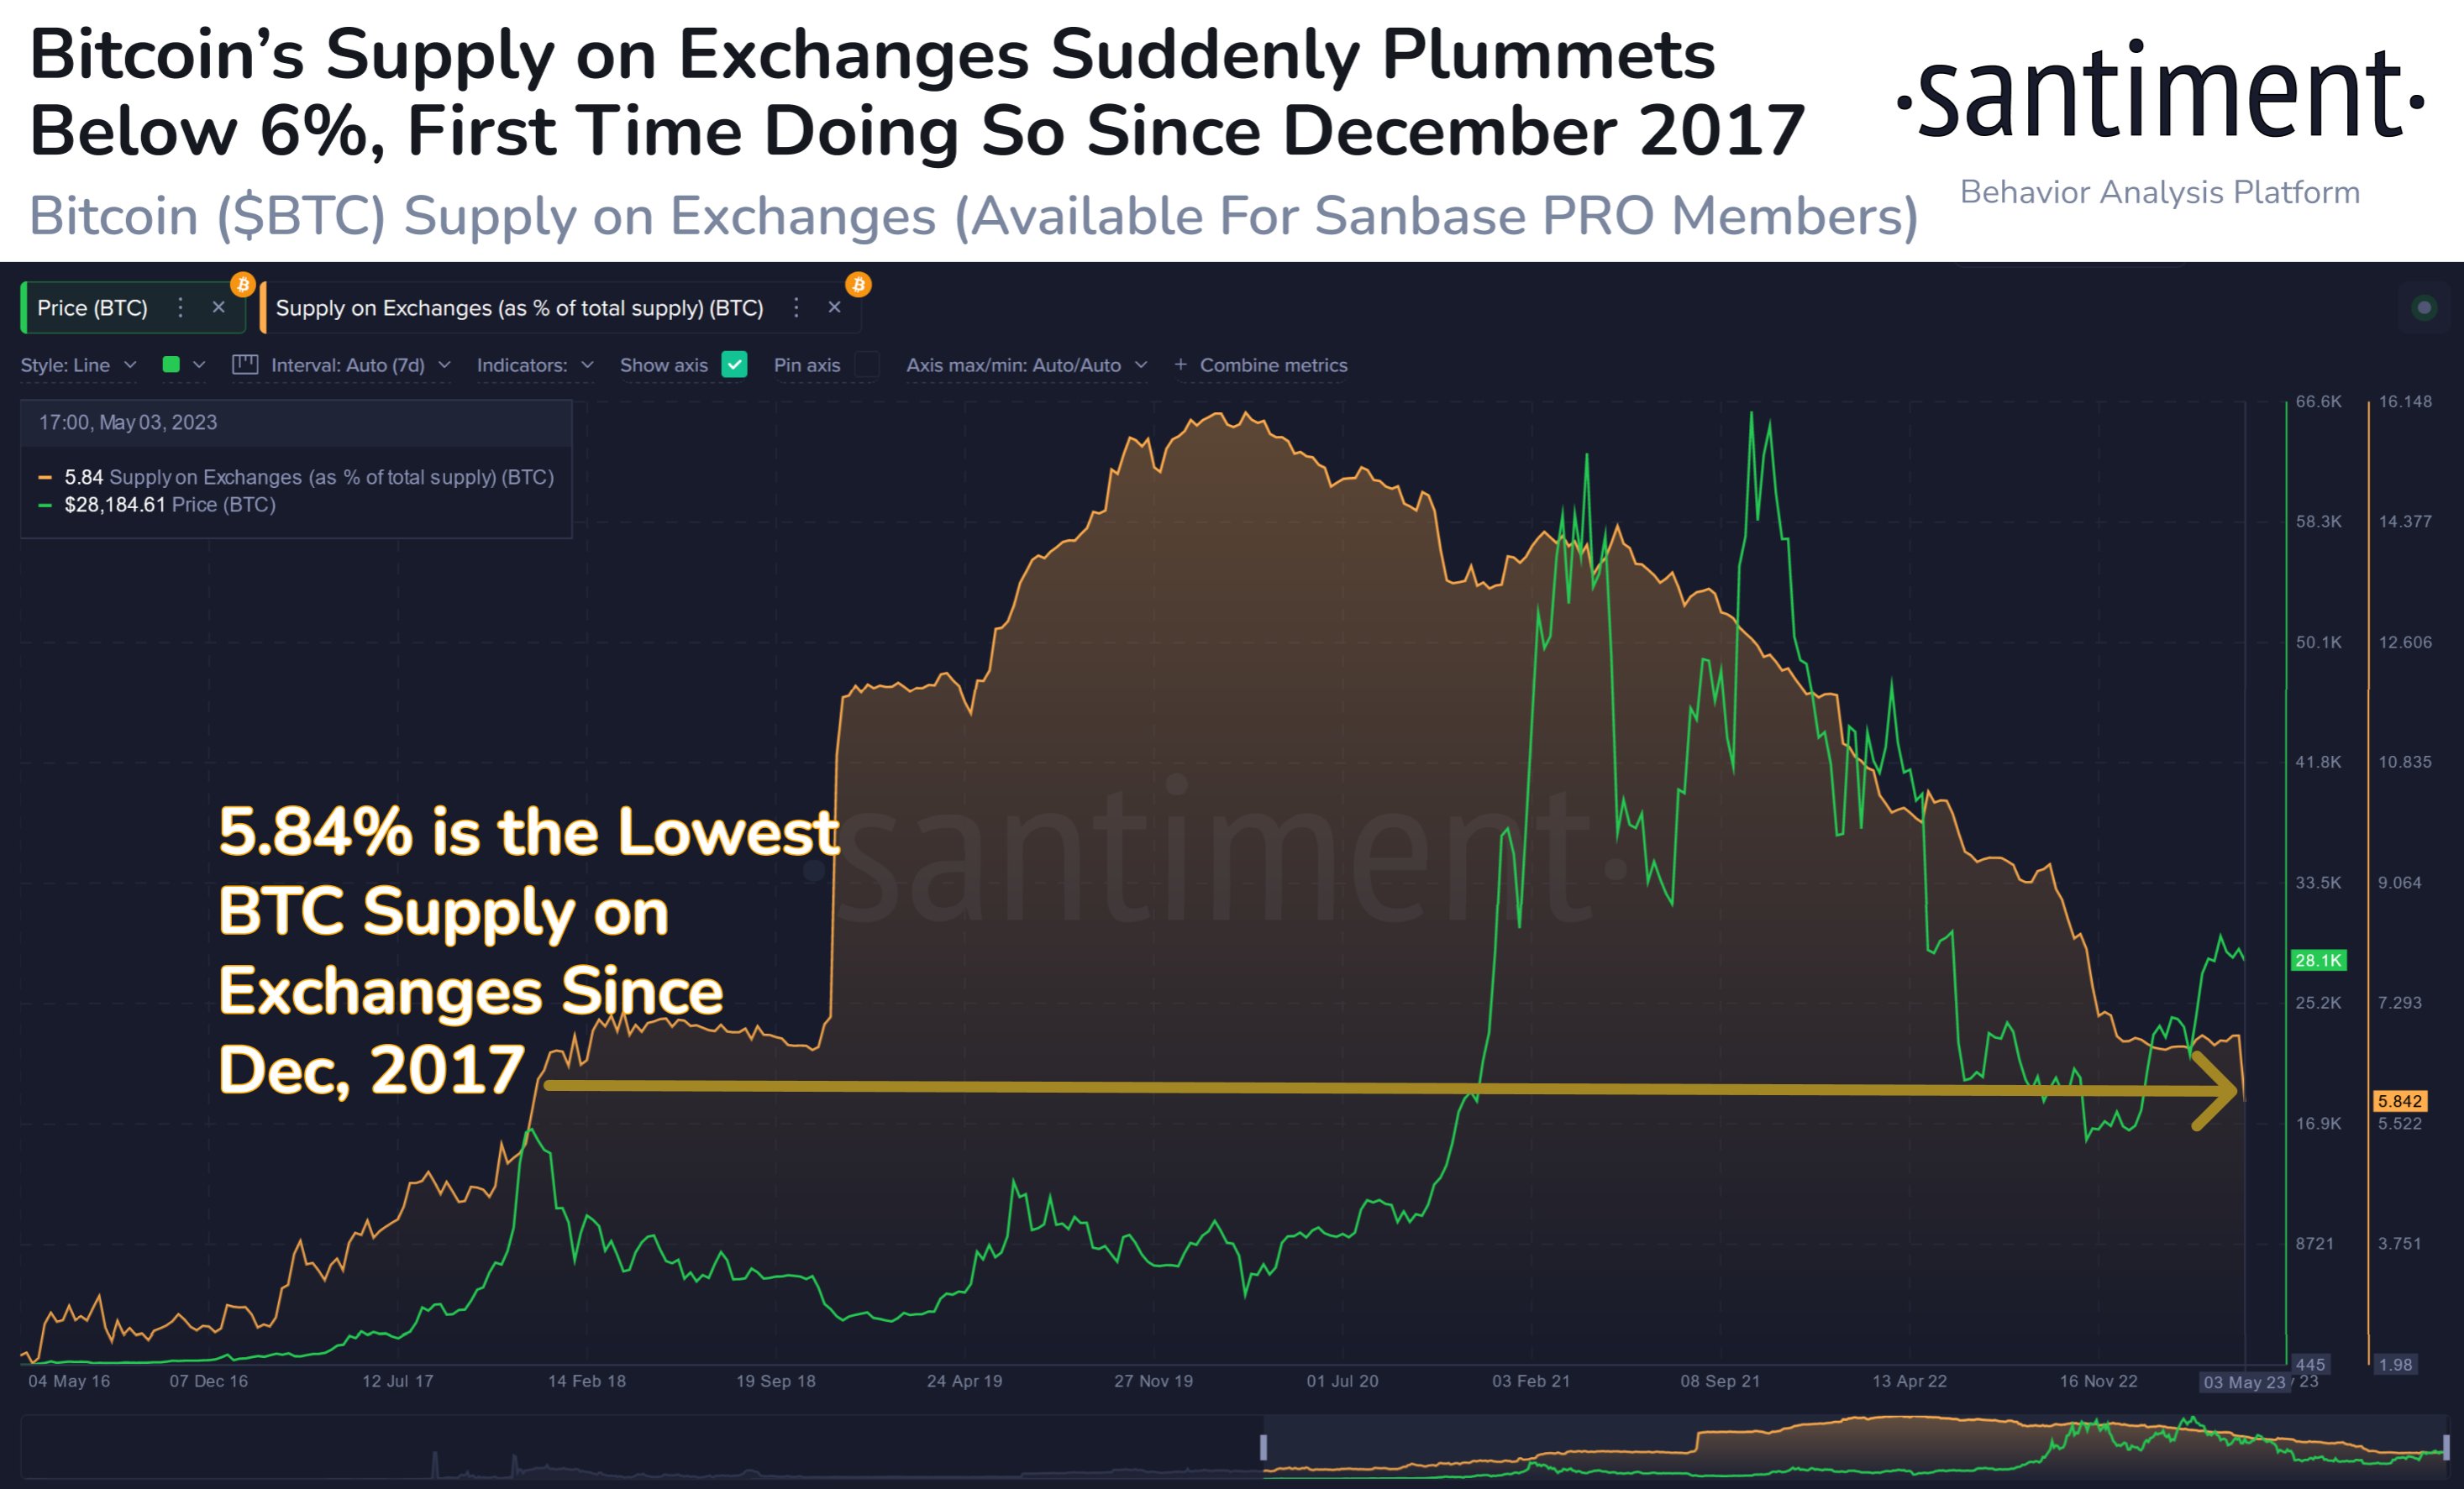
The value of the metric seems to have sharply gone down in recent days | Source: Santiment on Twitter
As shown in the graph above, Bitcoin supply on exchanges has been declining for a few years now, suggesting that investors have been steadily removing their coins from such platforms.
This decline particularly accelerated around the collapse of the cryptocurrency exchange FTX, as a platform like FTX going down put fear in the minds of investors about keeping their coins in centralized custody of exchanges.
However, since the rally started this year, the indicator has mostly moved sideways, as holders have started depositing more of their coins to these platforms to sell to take profit from the price rally.
However, things have been different in the last 24 hours. From the chart, it is visible that the indicator has seen a very sharp drop during this period, which suggests that an extreme amount of withdrawals have occurred.
According to on-chain data, this sharp plunge has come because one of the biggest whales on the Bitcoin network has moved 78,234 BTC (more than $2.1 billion) out of a Binance wallet.

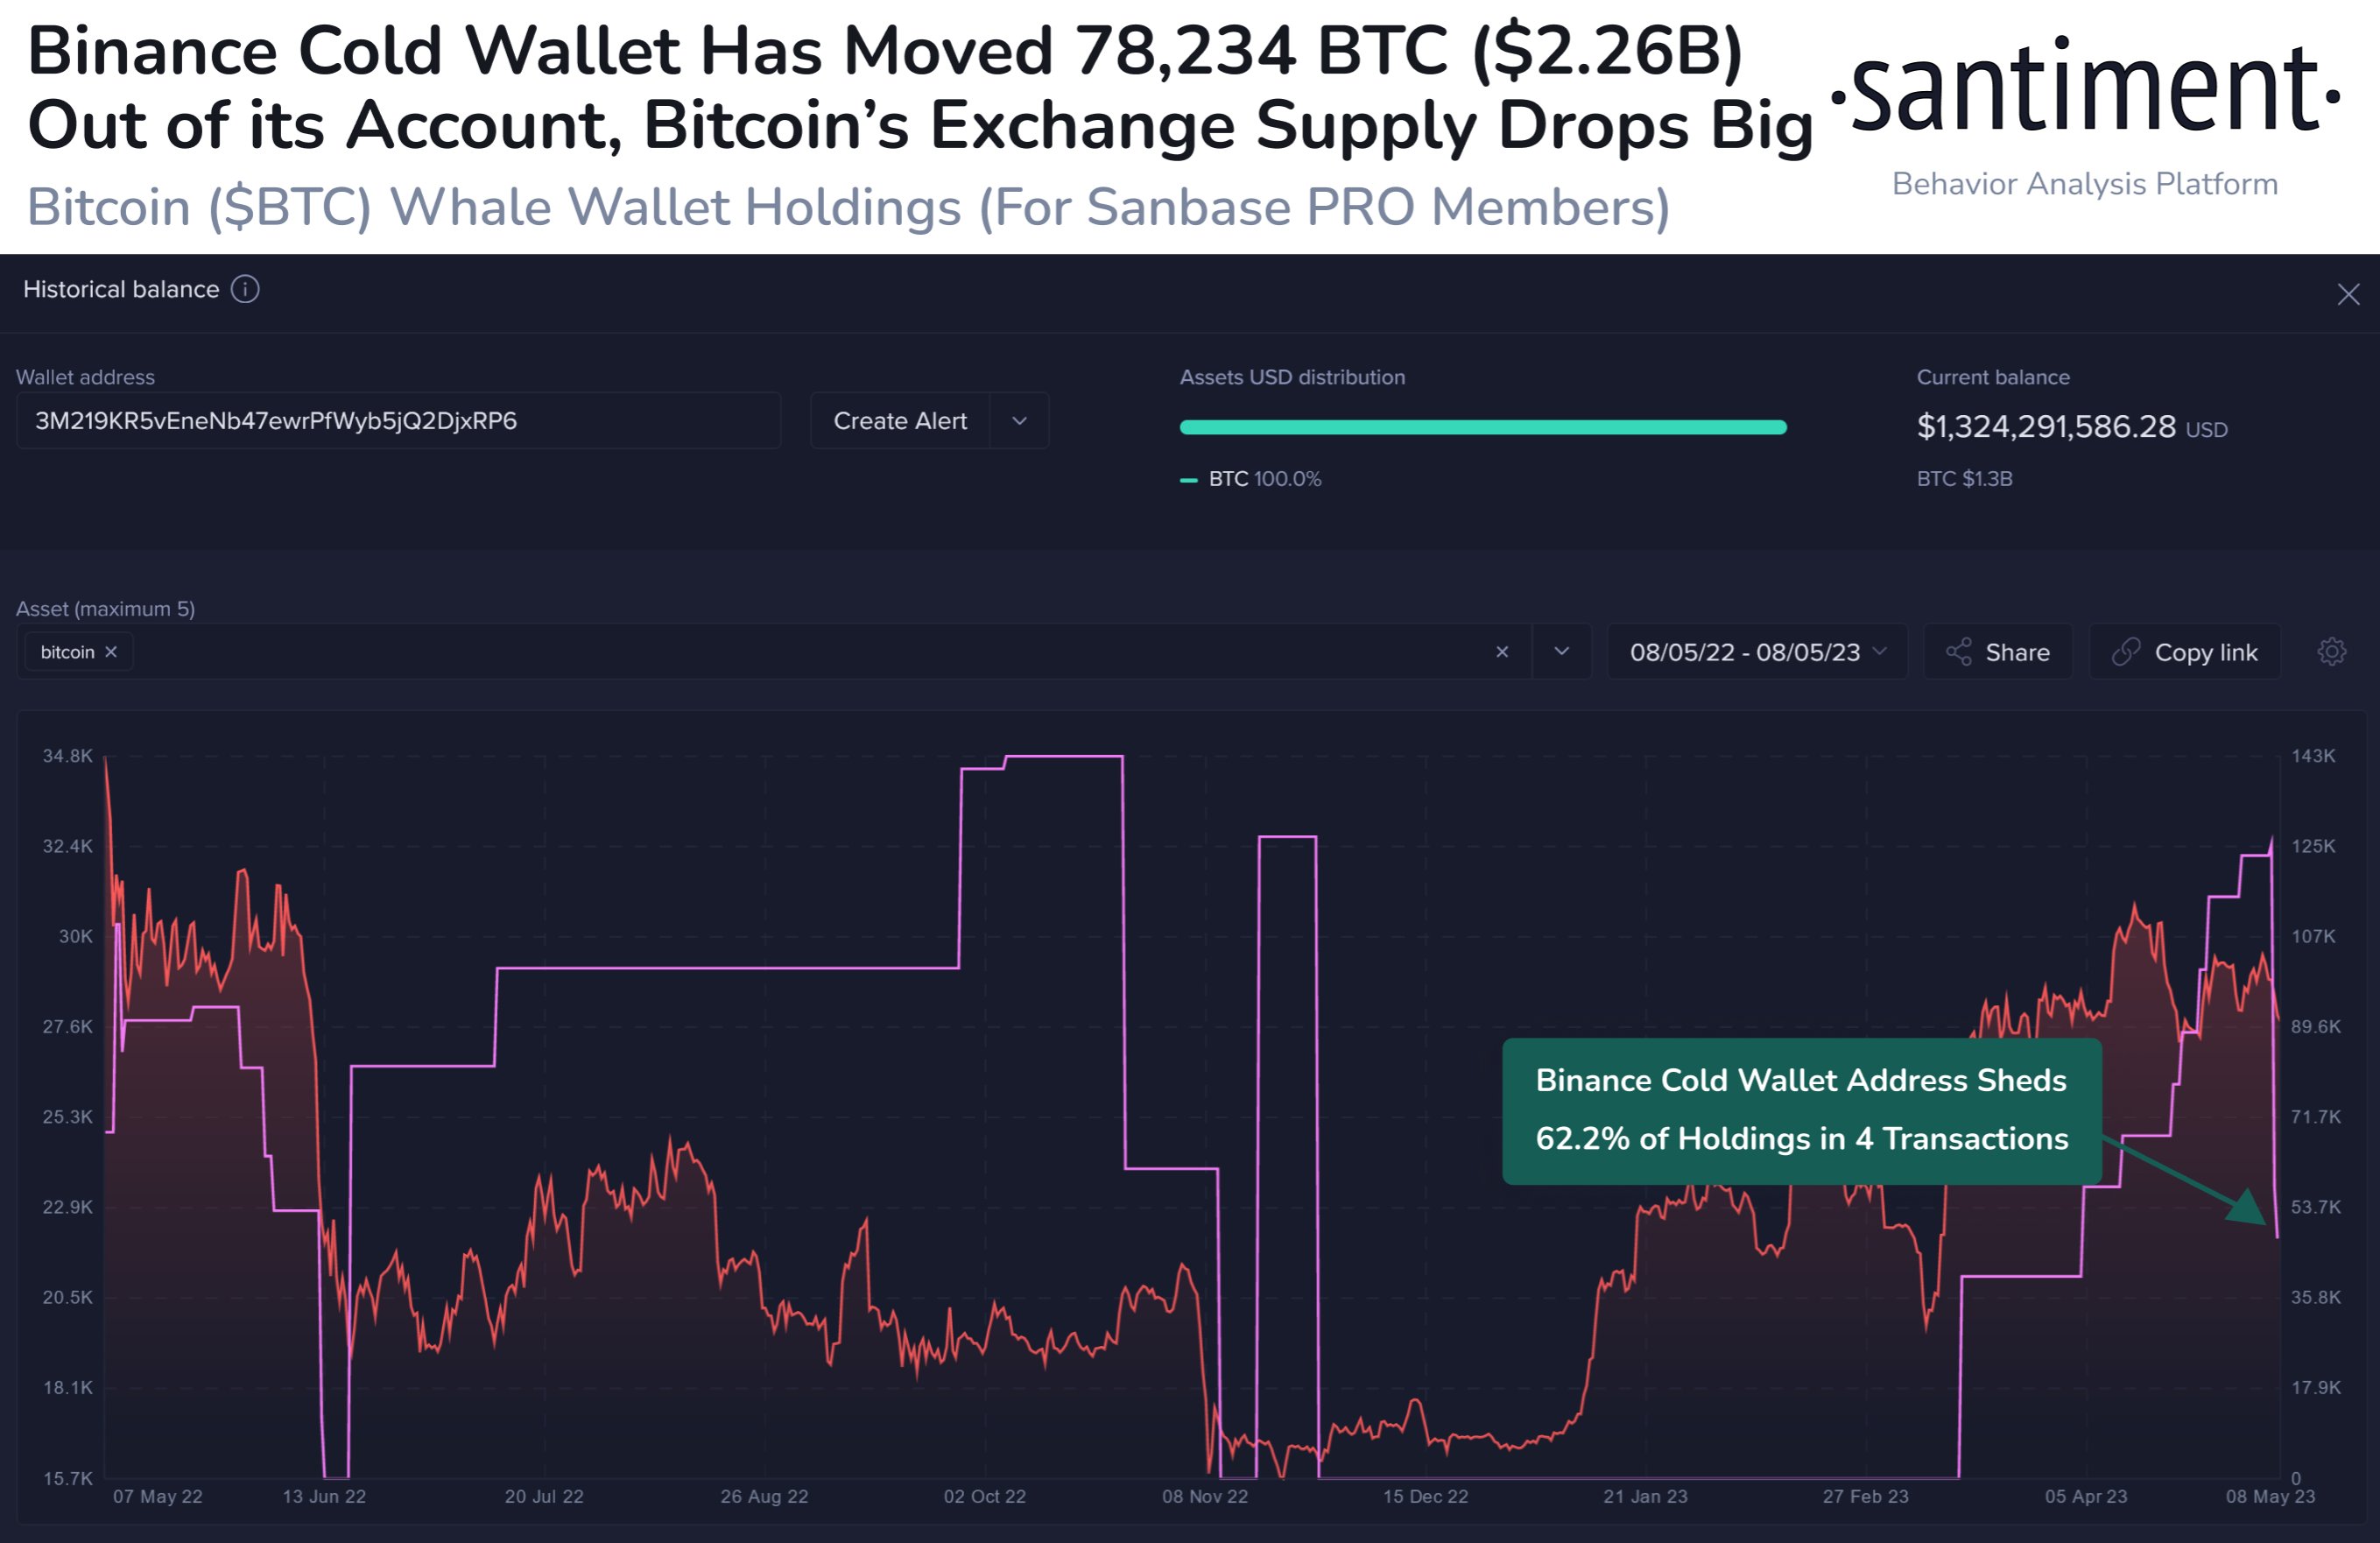
Looks like a sharp plunge has taken place in the holdings of this wallet today | Source: Santiment on Twitter
After this big move by the whale, Bitcoin supply on exchanges has now plunged to just 5.8%. The last time such a low percentage of the total supply was held by these platforms was way back in December 2017.
While this latest sharp decline in supply on exchanges may have bullish effects on price (as it may be a sign of accumulation from the whale), the longer-term decline in the indicator has greater significance.
It shows that investors in the Bitcoin market are becoming aware of the risks of keeping their coins on such platforms and are increasingly finding it preferable to keep their coins in self-custodians. This more decentralized BTC supply is a healthy development for the long-term potential of the market.
BTC price
At the time of writing, Bitcoin is trading around $27,500, down 1% in the last week.

BTC has plunged | Source: BTCUSD on TradingView
Featured image from Thought Catalog on Unsplash.com, Charts from TradingView.com, Santiment.net


