Bitcoin, Ethereum, Algorand Price analyzes the cryptonom

Bitcoin Analysis
Bullish Bitcoin market participants pushed back on Monday, ending three consecutive days of selling pressure from bearish traders. By the end of today’s daily session, BTC’s price was +$744.5.
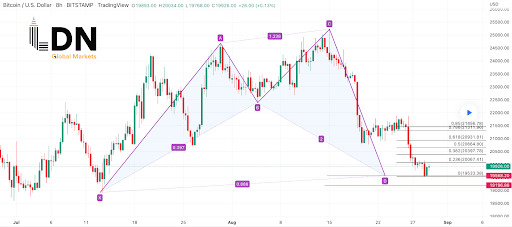
BTC/USD 8HR chart below from LDNGLOBAL MARKET is the first chart we provide analysis for today. BTC’s price trades between the 0.236 fibonacci level [$20,067.41] and 0.382 [$20,397.78]at the time of writing.
Above the 0.382 fib level, bullish traders are targeting 0.5 [$20,664.8]0.618 [$20,931.81]0.786 [$21,311.96]and 0.85 [$21,456.78].
Conversely, bearish BTC traders are targeting the 0.236 fib level with a secondary target of a full retracement of 0 [$19,533.38]. The third target to the downside for bearish traders is $17,611, which is the 12-month low for BTC.

Bitcoin’s moving average: 5-day [$21,145.02]20 days [$22,720.84]50 days [$21,852.37]100 days [$27,189.74]200 days [$35,792.36]Year to date [$33,185.17].
BTC’s 24-hour price range is $19,540-$20,427 and its 7-day price range is $19,540-$21,753.13. Bitcoin’s 52-week price range is $17,611-$69,044.
The price of bitcoin on this date last year was $46,989.7.
The average price of BTC for the last 30 days is $22,652.11 and its -12.1% for the same time period.
Bitcoin’s price [+3.81%] closed its daily candle worth $20,295.6 on Monday.
Ethereum analysis
Ether’s price rose 130% during July and early August, but has since lost 30% of its value over the past two weeks. Bullish traders managed to boost ETH’s price on Monday at a key turning point [$1,420] on the weekly time scale and ETH’s price closed its daily session +$126.32.
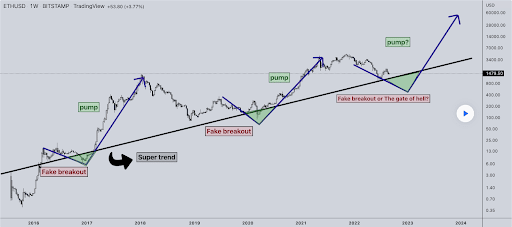
The ETH/USD 1W chart below by wikipedram96 shows how critical the current level of Ether’s price is at the time of writing. ETH’s price is clinging to a key support which if broken to the downside by bearish traders could lead to an eventual trip down to test the $400-$500 level.
There is really no advantage at the moment for bullish traders as bearish traders have put pressure on them since bulls failed to break the $2k level earlier this month with any real determination.

Ether’s moving average: 5-day [$1,623.10]20 days [$1,731.66]50 days [$1,472.49]100 days [$1,846.92]200 days [$2,577.16]Year to date [$2,314.95].
ETH’s 24-hour price range is $1,422.08-$1,553.76 and its 7-day price range is $1,422.08-$1,713.59. Ether’s 52-week price range is $883.62-$4,878.
The price of ETH on this date in 2021 was $3,228.54.
The average price of ETH for the last 30 days is $1,708.41 and its -7.19% over the same time frame.
Ether price [+8.86%] closed its daily candle on Monday at $1,552.52 and bulls went on a three-day slide in negative numbers.
Algorand analysis
Algorand’s price was sent more than 5% higher on Monday and ended at its daily candle of +$0.0156.
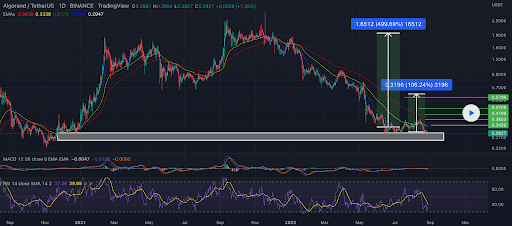
The ALGO/USD 1D chart below from Altcenter_Analysis shows the levels that are integral to bullish traders in the short term. The overhead targets for bullish ALGO traders since defending the $0.28 level are $0.3409, $0.3803, $0.4199, $0.4709 and $0.5799.
At odds with bulls are bearish Alogrand traders who have been in control of this market for the past week. Bearish ALGO traders are looking to push ALGO’s price below the $0.27 level and break the bottom of the current $0.2556 range.

ALGO’s moving average: 5-day [$0.301]20 days [$0.333]50 days [$0.328]100 days [$0.423]200 days [$0.793]Year to date [$0.654].
ALGO’s 24-hour price range is $0.2798-$0.2978 and its 7-day price range is $0.2798-$0.31. Algorand’s 52-week price range is $0.2753-$2.85.
AlgorandThe price on this date last year was $1.01.
The average price of ALGO in the last 30 days is $0.33 and its -10.79% over the same duration.
Algorand’s price [+5.52%] ended its daily session on Monday worth $0.298 and back with green digits after ending Sunday’s daily candle with negative digits.


