Bitcoin deep dive in the chain: BTC falls below the global electricity cost
A chorus of recession rings
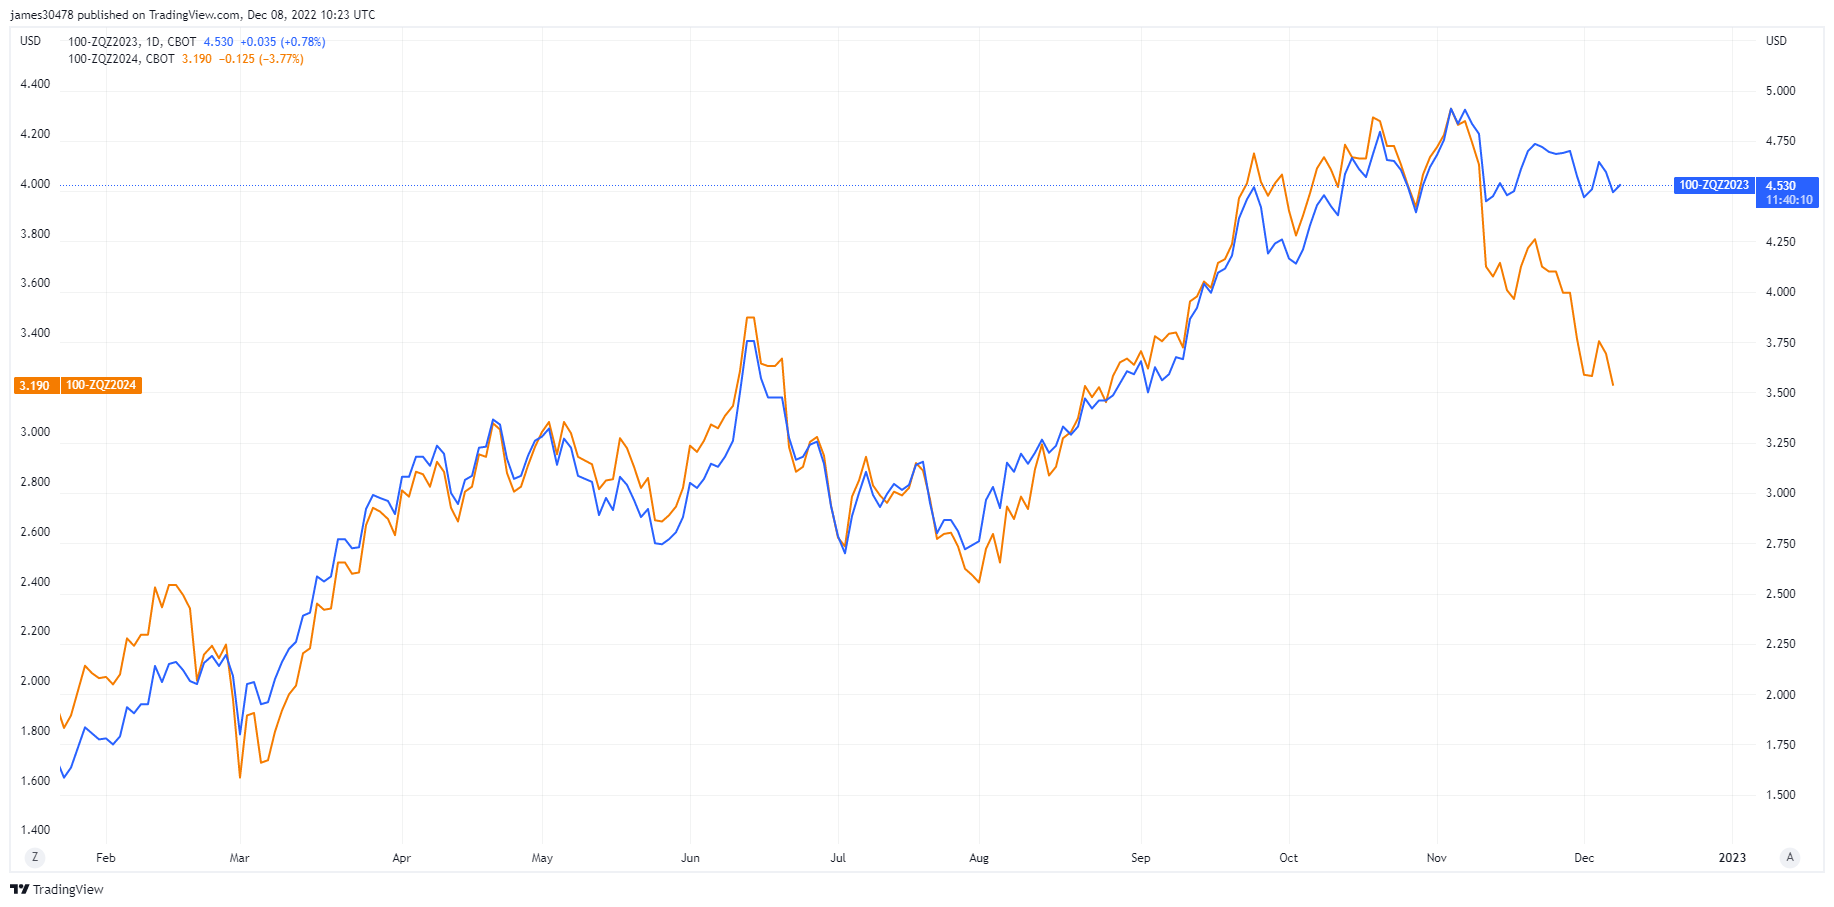
Fed officials banned from speaking ahead of next week’s fed funds announcement; investors have been left thinking about US rate cuts priced in for 2023 and 2024. While Fed Funds Rate Futures for December 2023 are priced at 4.5%, December 2024 is currently priced at 3.5%; an aggressive rate cut occurred this week.
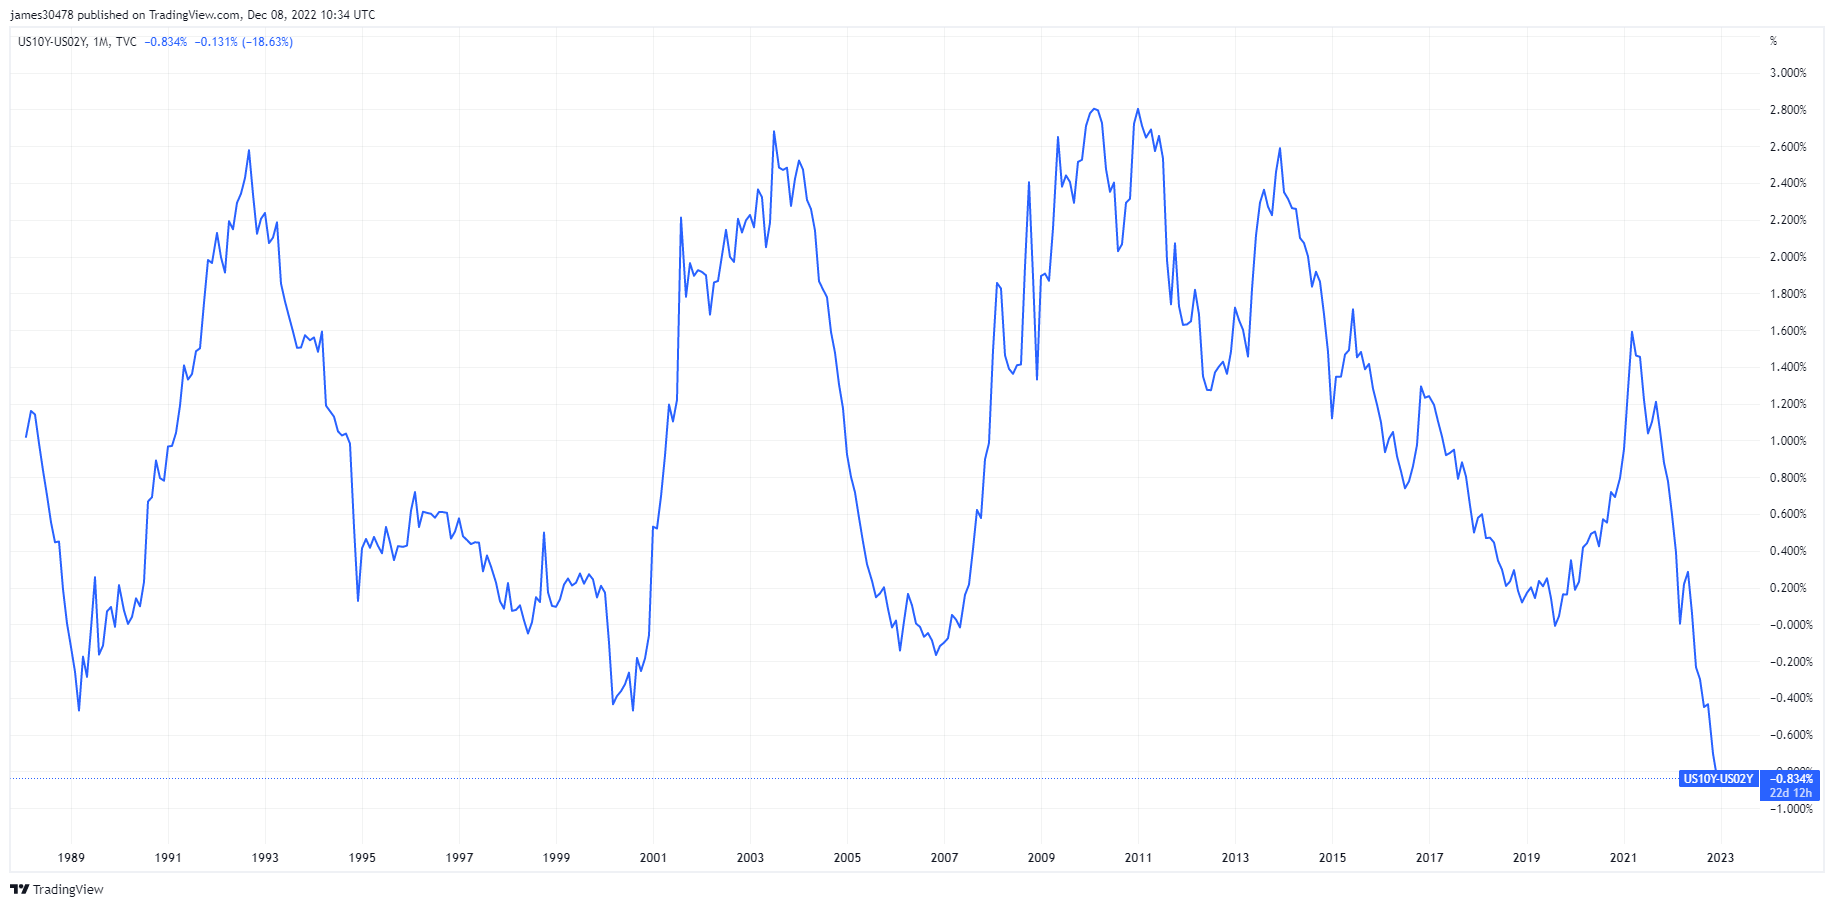
Jerome Powell and the Fed’s main goals are to control inflation and tighten fiscal conditions; Since mid-October, however, financial conditions have eased as bond yields have fallen, credit spreads have tightened and reversed to multi-decade levels while stocks have risen. The spread between the ten- and two-year interest rate closed to a new width of -84bps.
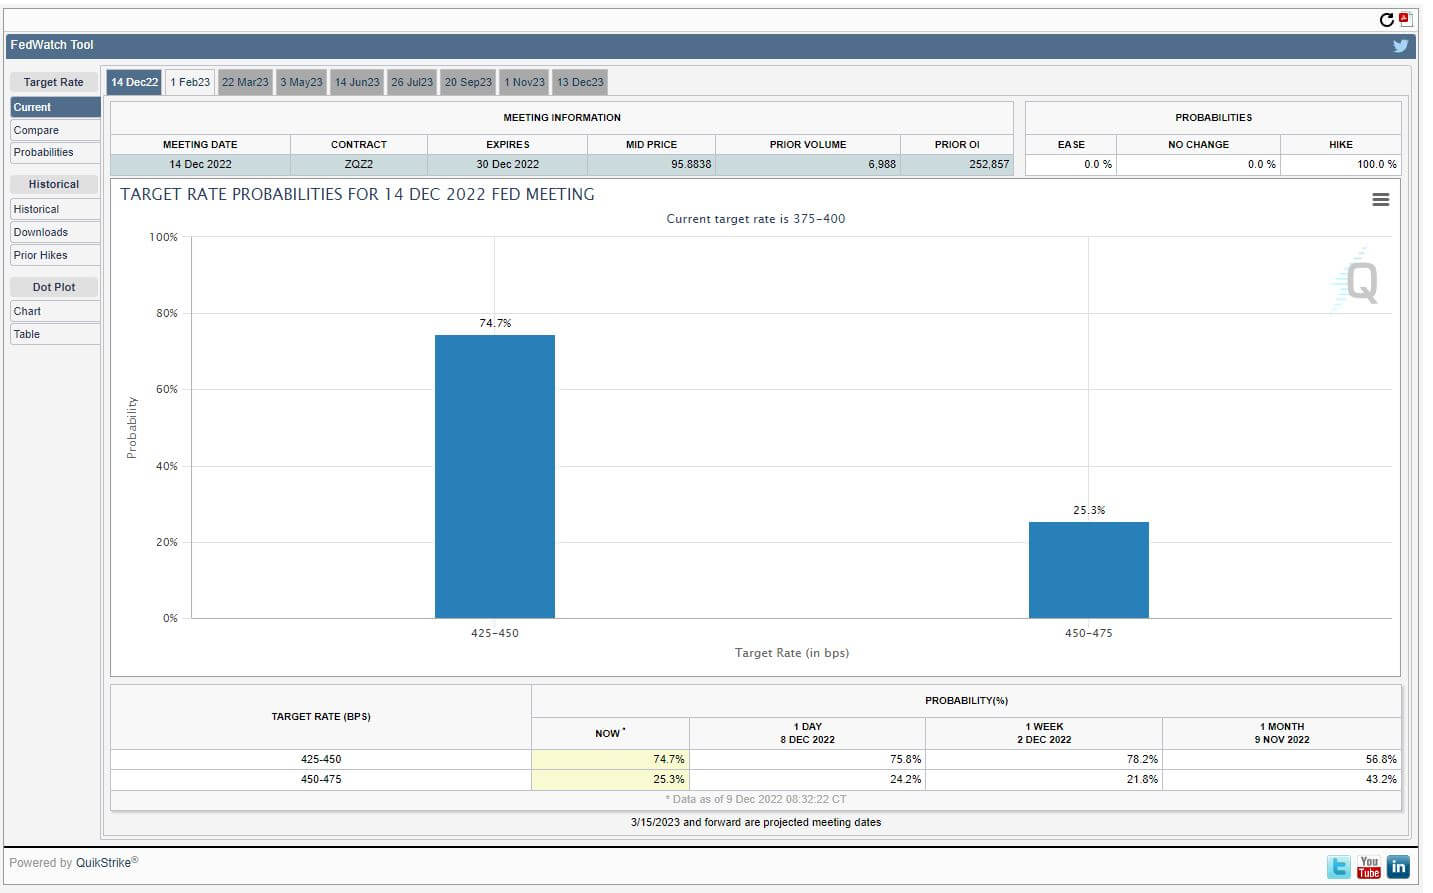
December 9th saw worse than expected PPI data, with the real test for the Treasury market coming next week’s CPI report. Depending on the CPI results, the Fed Funds rate hike could change, which currently sees a 75% probability of a 50bps rate hike taking the Fed Funds rate to 4.25-4.50%.
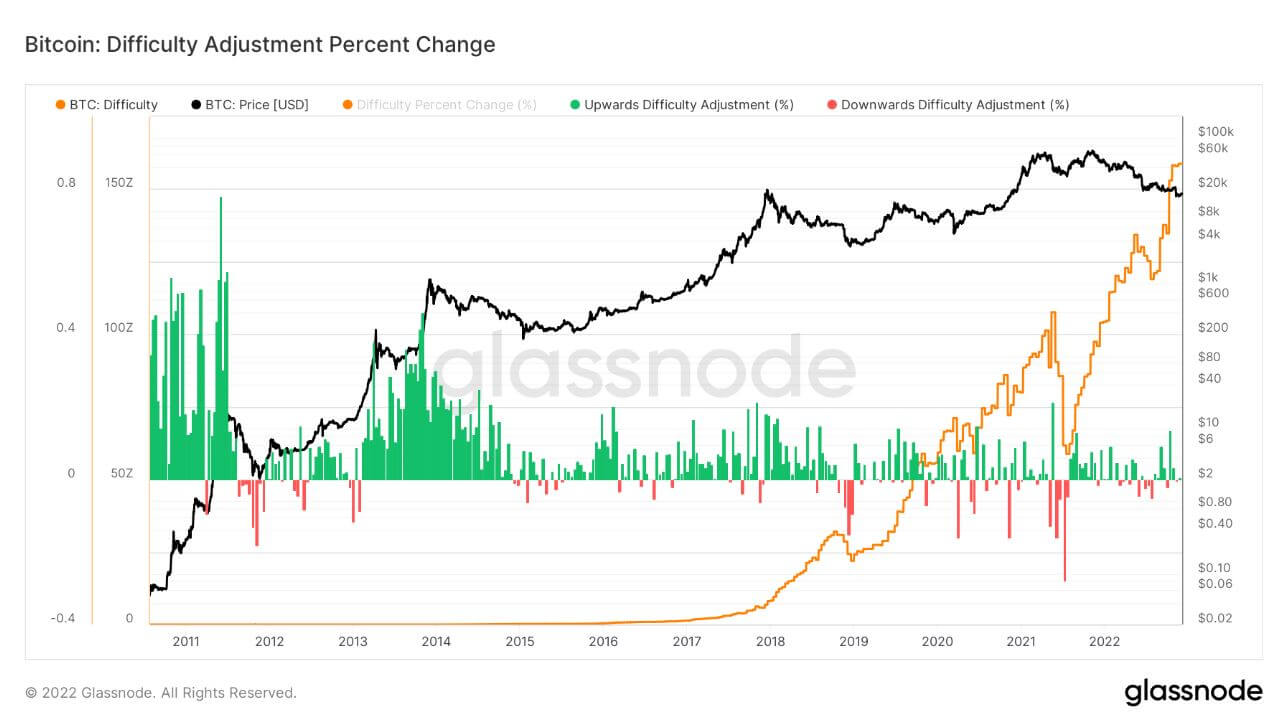
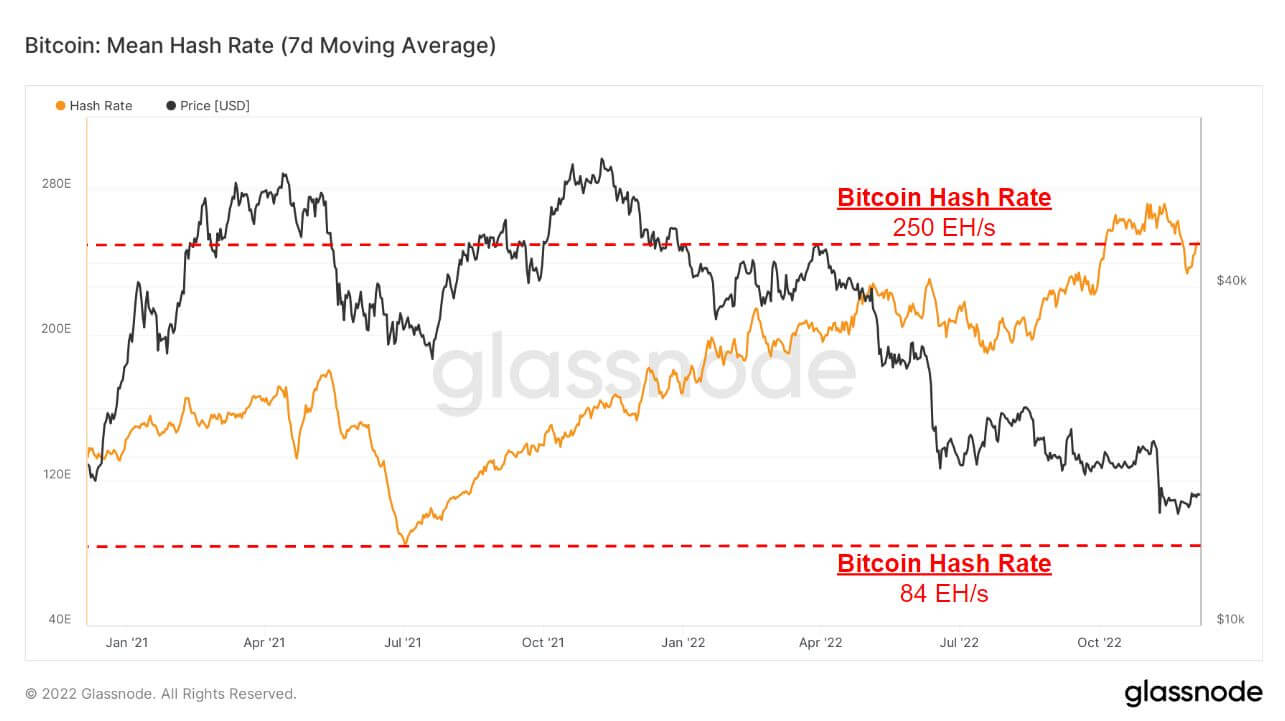
Bitcoin mining and hashrate difficulties continue
Bitcoin difficulty adjusted 7.32% on the morning of December 6, the biggest negative adjustment since July 2021 which saw over a 20% adjustment due to China banning Bitcoin last summer as a result of miners being disconnected and hash- the rate fell to 84EH/s .
A drop in mining difficulty will see relief on miners’ faces, but this relief may be short-lived as the hashrate is already ticking back to levels around 250EH/s.
Since the China ban last summer, both mining difficulty and hash rate have increased by a total of 3 times, showing that the long-term security of Bitcoin has never been stronger.
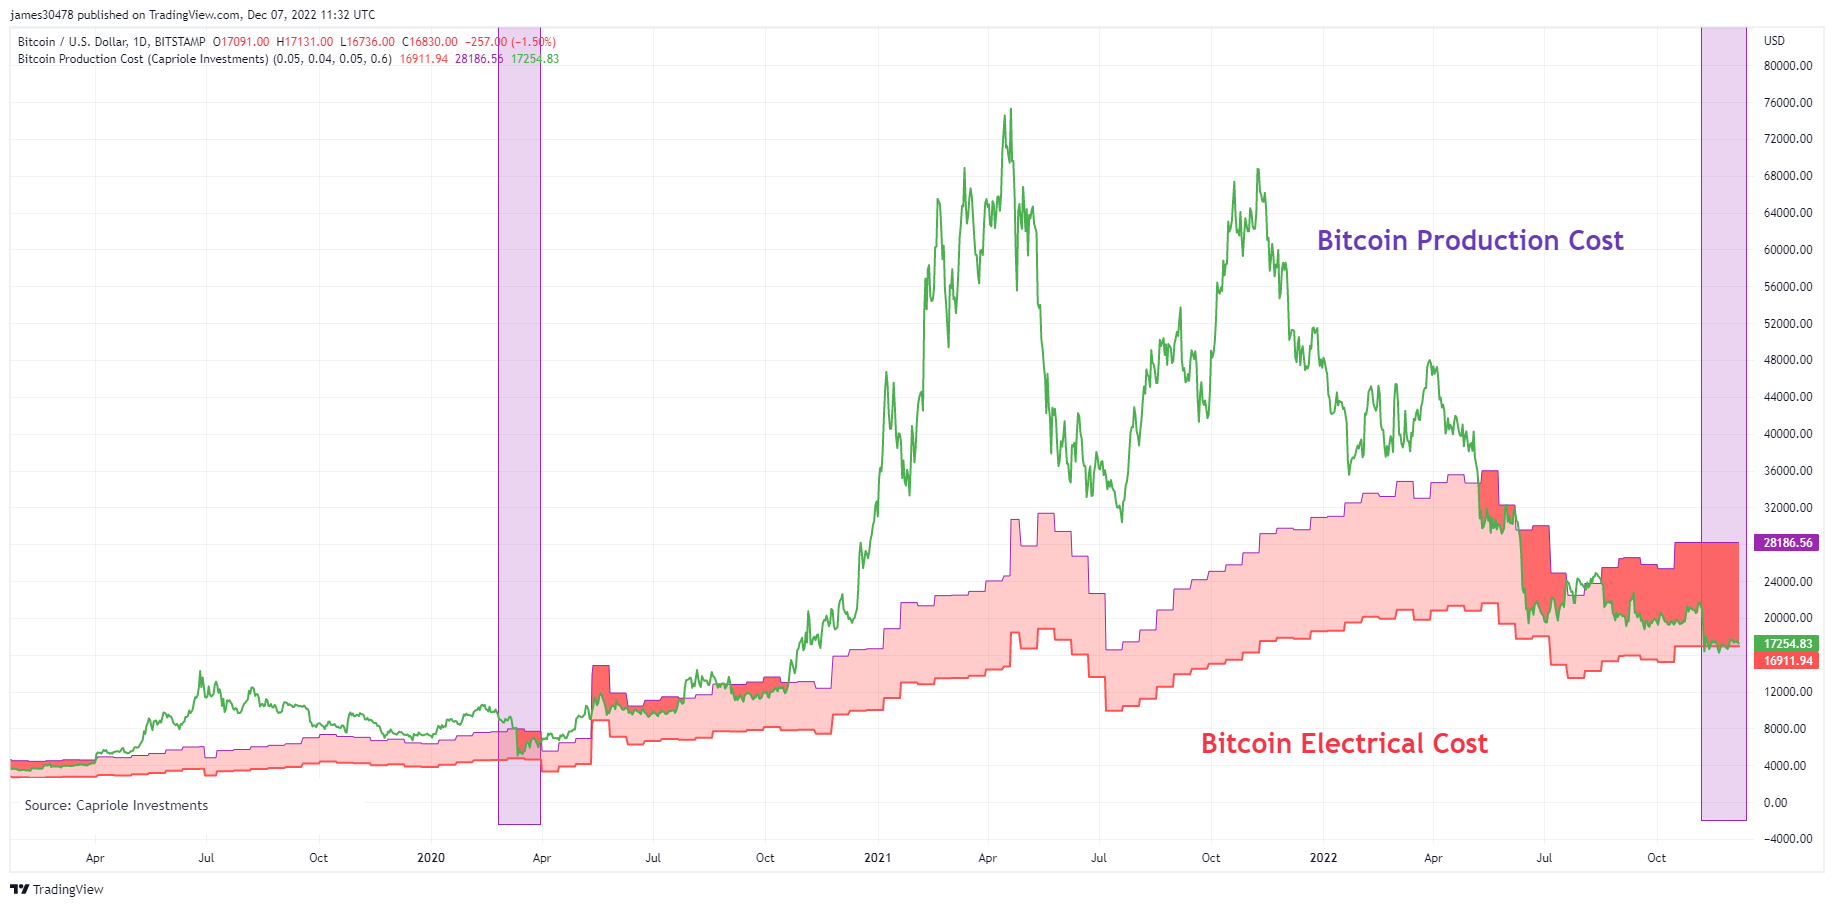
Bitcoin falls below the global electric cost
A model created by Charles Edwards (Capriole Investments) on Bitcoin’s electricity and production cost model to identify how much it costs to produce one Bitcoin.
This model has provided a good floor for the price of Bitcoin during bear markets, and only four periods in Bitcoin’s history has the price gone below the global Bitcoin electricity cost.
The last time the Bitcoin price fell through the model was covid and now during the FTX collapse the price was below the global Bitcoin electric cost for the majority of November, about $16.9K, and has fallen back below it again.
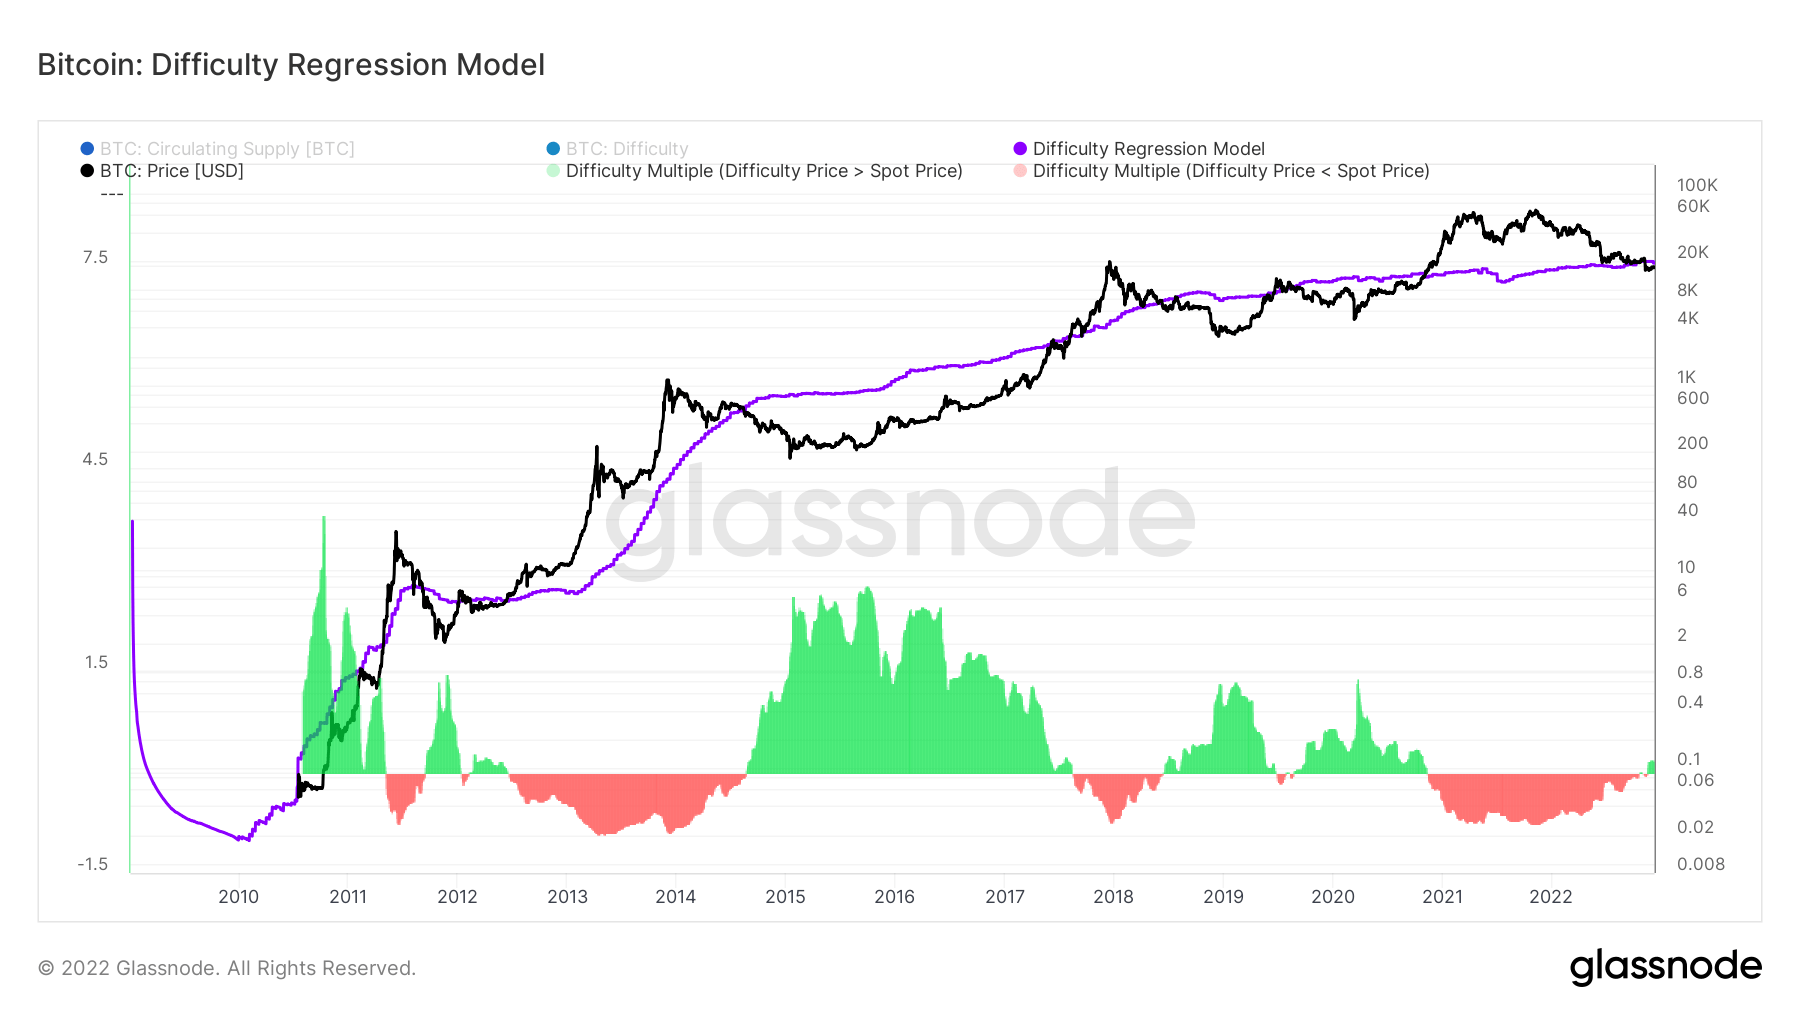
A similar model created by Hans Hague modeled the idea of the difficulty regression model. By creating a log-log regression model by difficulty and market value, this model calculates the total cost of producing one bitcoin.
The cost to produce one Bitcoin is currently $18,872, higher than the current Bitcoin price. Bitcoin price fell below the regression model during the November 15 FTX collapse and for the first time since the 2019-20 bear market – a deep value zone for Bitcoin.
Accumulation of the bear market
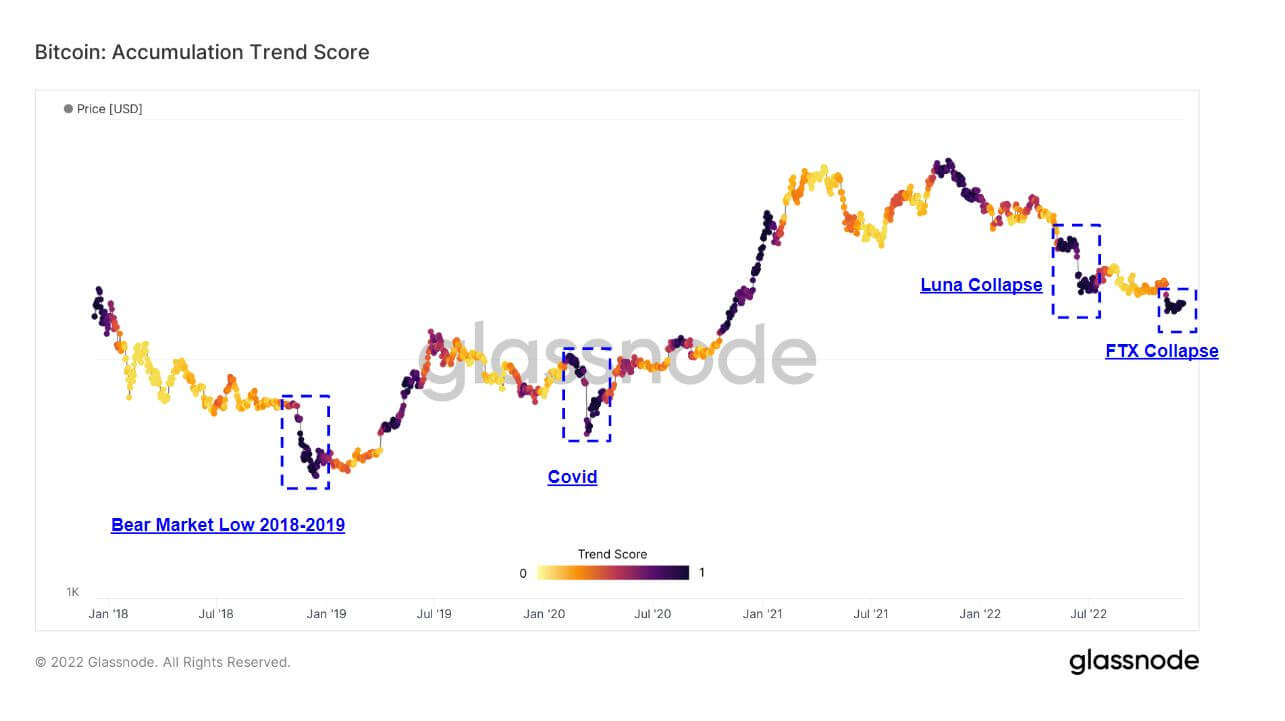
The Accumulation Trend Score is an indicator that reflects the relative size of entities actively accumulating coins on the chain in terms of their BTC holdings. The Accumulation Trend Score scale represents both the size of the entity’s balance (their participation score) and the amount of new coins they have acquired/sold over the past month (their balance change score).
An accumulation trend score closer to 1 indicates that, overall, larger units (or a large portion of the network) are accumulating, and a value closer to 0 indicates that they are distributing or not accumulating. This provides insight into the balance sheet size of market participants and their accumulation behavior over the past month.
Highlighted below are the instances that a Bitcoin capitulation has occurred while Bitcoin investors are accumulating, the FTX collapse that sent Bitcoin down to $15.5k has seen the same amount of accumulation that appeared during the Luna collapse, covid and the bottom of the 2018 bear market .
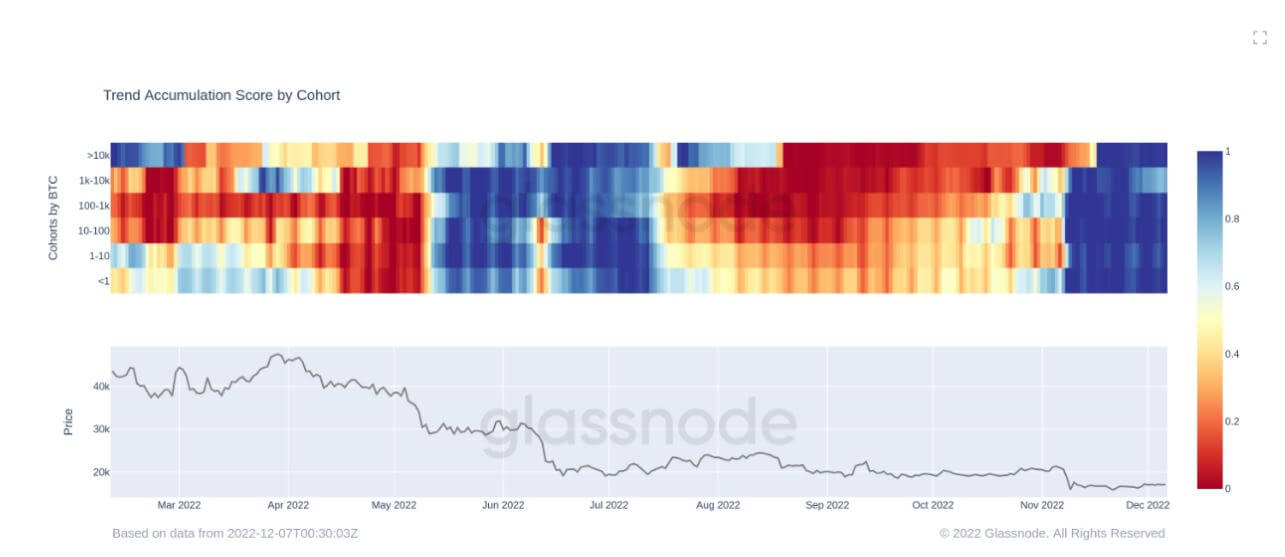
The Accumulation Trend Score by Cohort has the distribution of each cohort to show the levels of accumulation and distribution through 2022, currently in a significant period of accumulation from all cohorts for over a month that has never happened in 2022. Investors are seeing the value.
Open futures rates, leverage and volatility decreased
Due to the macro climate and general sentiment, many risks have been taken by the market, evident in Bitcoin derivatives.
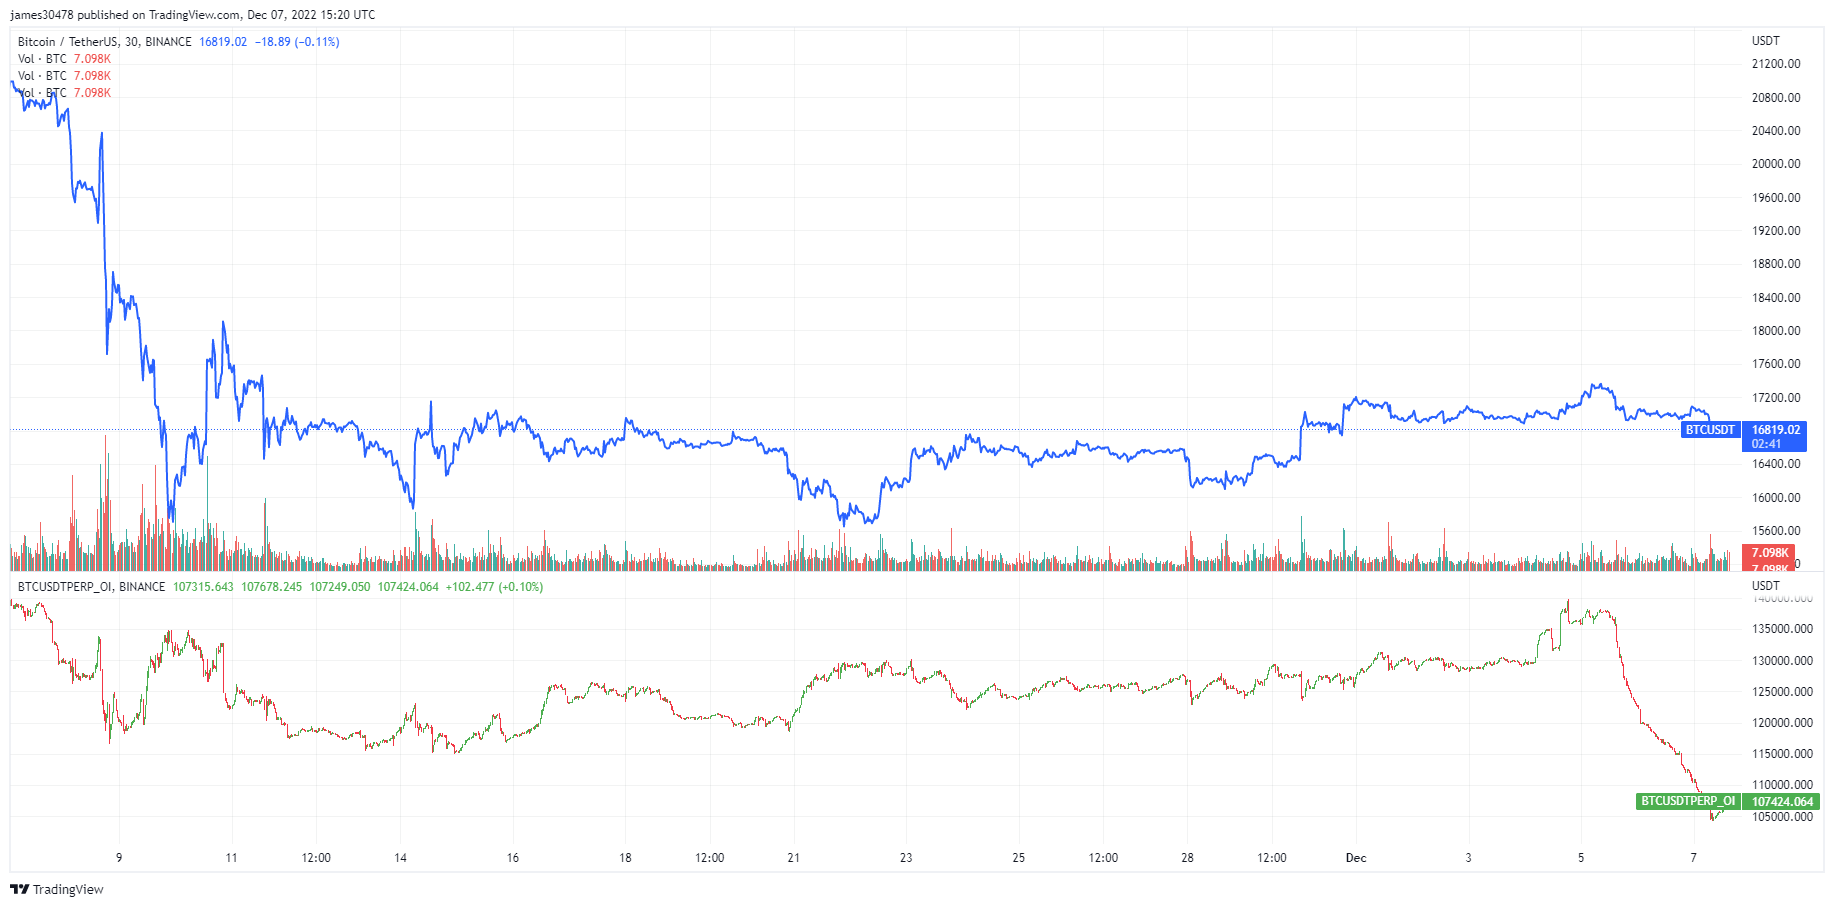
Bitcoin open interest on Binance is now back to July levels. Futures open interest is the total funds allocated in open futures contracts. Over 35K BTC has been liquidated as of December 5, equivalent to $595m; this is about a 30% reduction in OI.
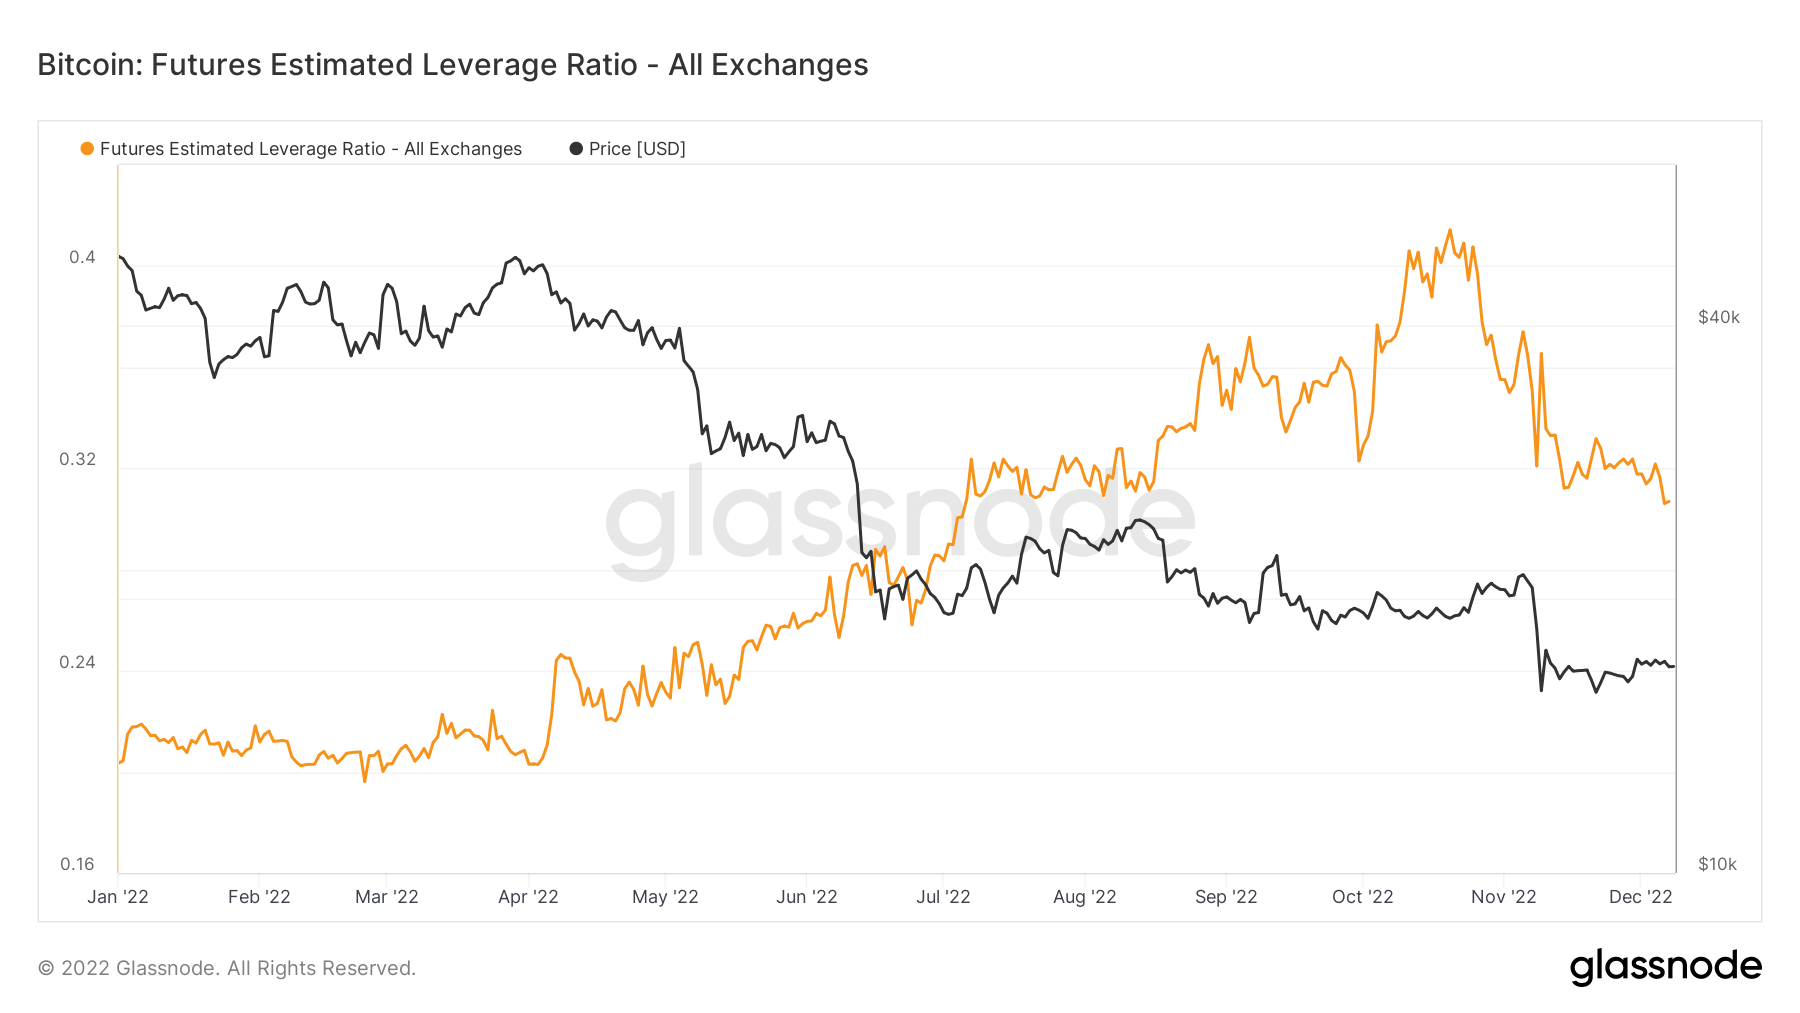
The less leverage in the system, the better; this can be quantified by the Futures Estimated Leverage Ratio (ELR). ELR is defined as the ratio between the open interest in futures contracts and the balance of the corresponding exchange. ELR is reduced from the peak of 0.41 to 0.3; however, at the beginning of 2022 it was at a level of 0.2, and a lot of influence is still being built in the ecosystem.
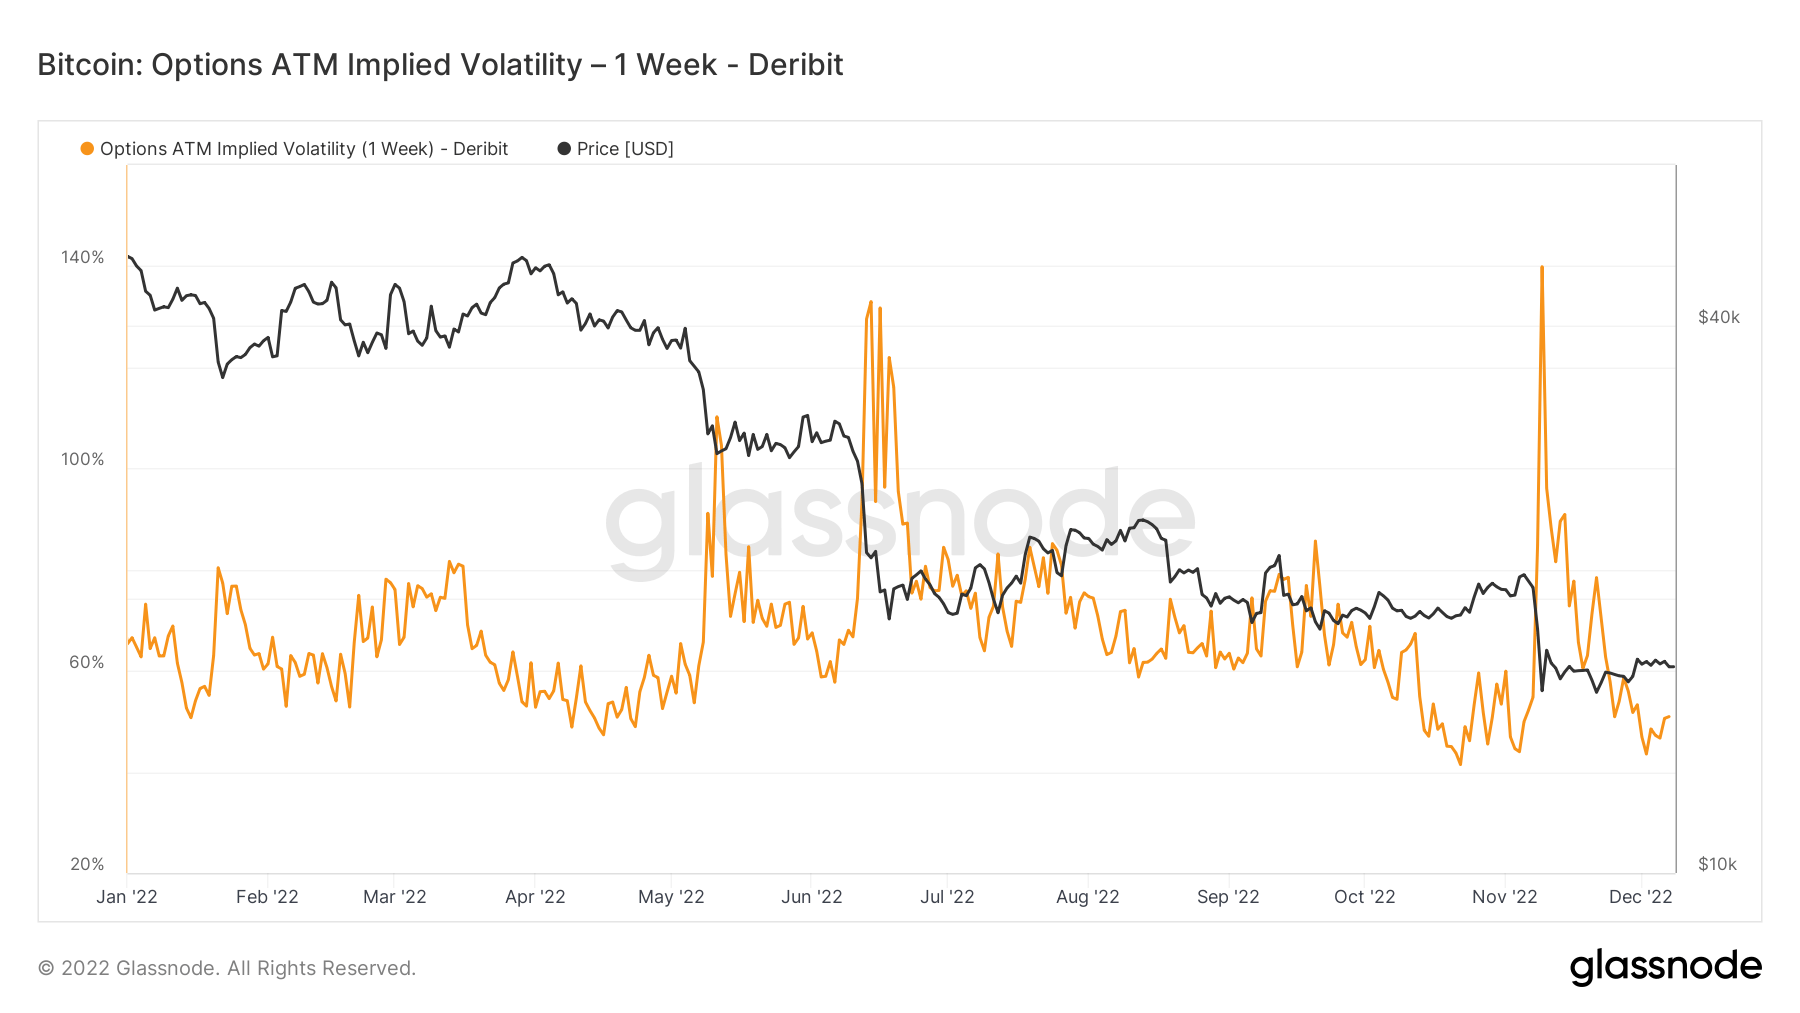
Implied volatility is the market’s expectation of volatility. Given the price of an option, we can solve for the expected volatility of the underlying asset. Formally speaking, implied volatility (IV) is the one standard deviation area for the expected movement of an asset price over a year.
Viewing the At-The-Money (ATM) IV over time provides a normalized view of volatility expectations that will often rise and fall with realized volatility and market sentiment. This calculation shows the ATM’s implied volatility for option contracts expiring one week from today.
Similar to the Luna collapse back in June, the implied volatility for Bitcoin had decreased again after the FTX implosion, to year-to-date lows.
A huge stablecoin supply waiting on the sidelines could trigger a bull run
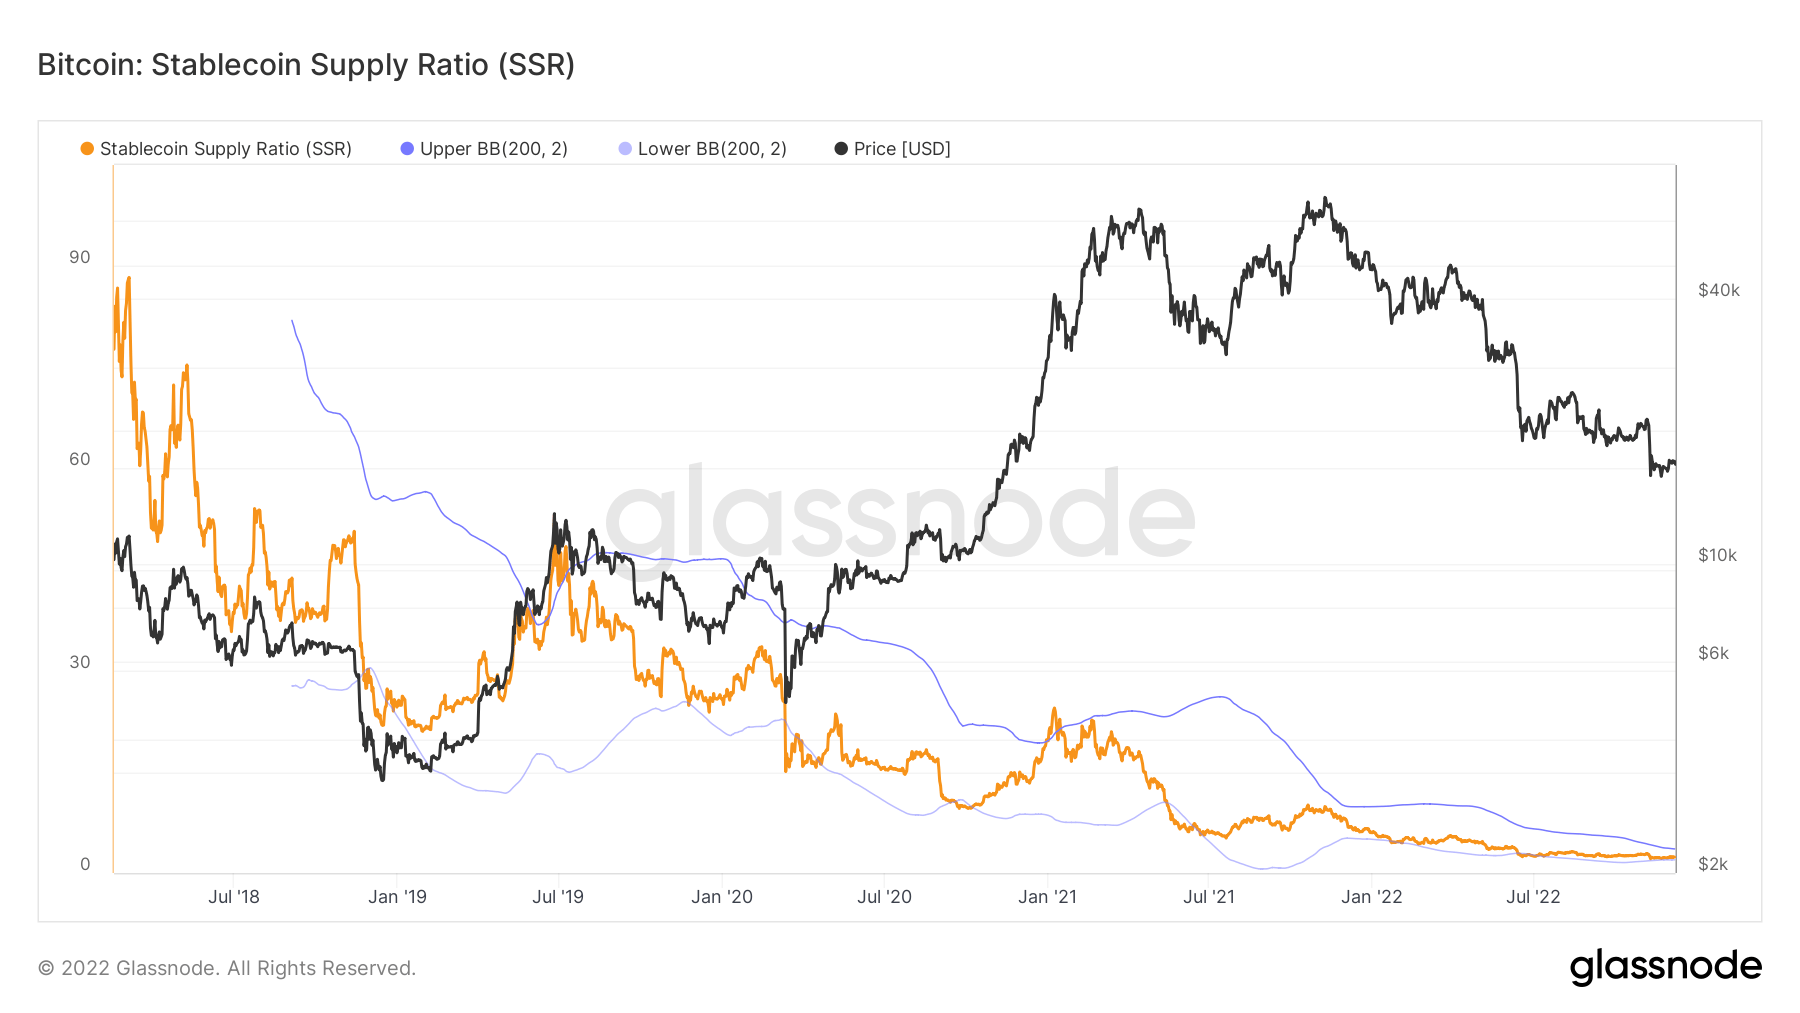
Stablecoin Supply Ratio (SSR) is the ratio between Bitcoin supply and the supply of stablecoins expressed in BTC, or: Bitcoin Market cap / Stablecoin Market cap. We use the following stablecoins for the supply: USDT, TUSD, USDC, USDP, GUSD, DAI, SAI and BUSD.
When SSR is low, the current stablecoin supply has more “purchasing power” to buy BTC. It is a proxy for the supply/demand mechanics between BTC and USD.
The ratio currently stands at 2.34, the lowest it has been since 2018, while SSR was at a ratio of 6 in January 2022. The ratio is trending lower as the increase in stablecoin purchasing power continues.
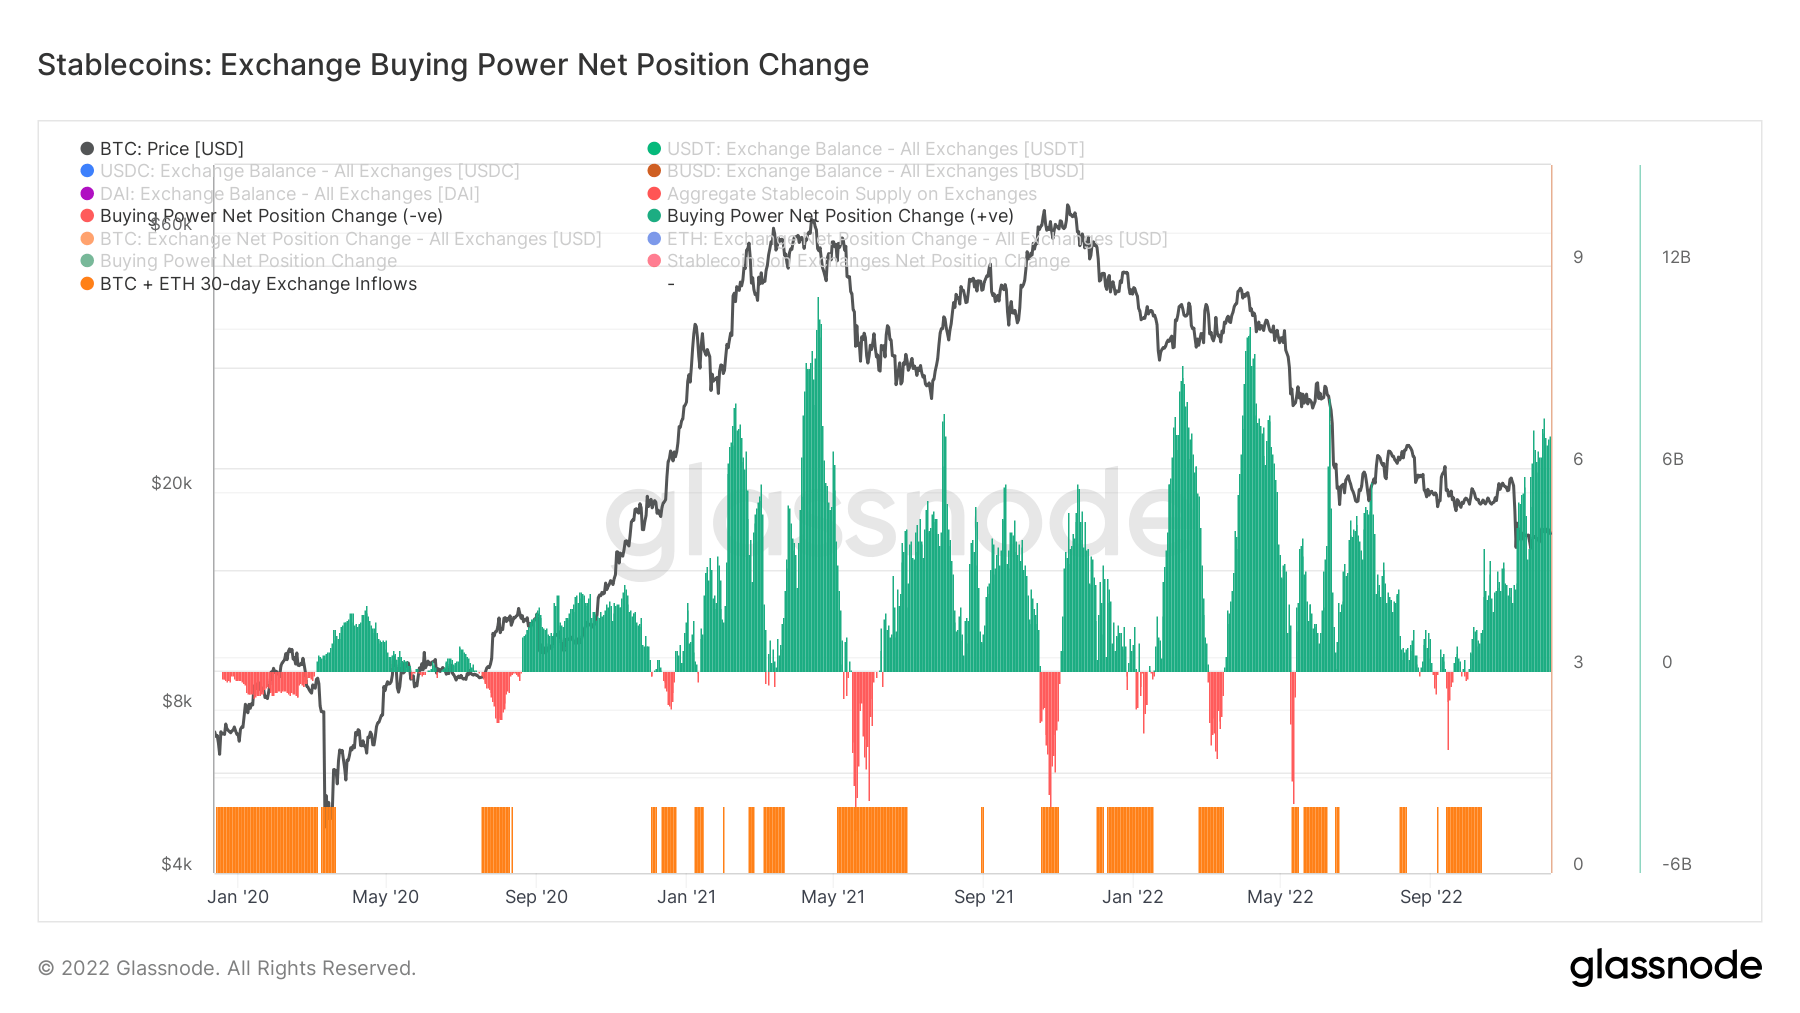
While the change in exchange purchasing power net position supports this, this chart shows the 30-day purchasing power for stablecoins on exchanges. It considers the 30-day change in major stablecoin supplies on exchanges (USDT, USDC, BUSD and DAI) and subtracts the USD-denominated 30-day change in BTC and ETH flows.
Positive values indicate a more significant or increasing USD volume of stablecoins flowing into exchanges relative to BTC + ETH over the past 30 days. It generally suggests more stable coin-denominated purchasing power available on exchanges relative to the two main assets.
In the last two years, the purchasing power of stablecoins has only increased by over seven billion of the purchasing power of stablecoins, and is trending towards peaks last seen since the beginning of the year.