Bitcoin Bearish Signal: Old Supply on the Move Again
On-chain data shows that some old Bitcoin supplies have recently been moved to exchanges, which could be bearish for the crypto price.
Bitcoin Exchange Inflow CDD has increased over the past day
As pointed out by an analyst in a CryptoQuant post, long-term holders have deposited some coins into exchanges over the past day.
There are two relevant indicators here; first is the “exchange inflow”, which measures the total amount of Bitcoin sent into wallets of all centralized exchanges.
Second, there is a concept called “coin days”, which is used as a measure of the dormant supply on the network. Every time 1 BTC sits idle on the chain for 1 day, it accumulates 1 coin day. The total coin days therefore tell us how many days the supply has been untouched.
However, when a coin that has accumulated some coin days shows some movement, those coin days are reset to zero, or “broken”. “Coin Days Destroyed” (CDD) is a metric that keeps track of the number of such coin days that are reset across the network.
Now, here is a chart showing the trend in Bitcoin CDD specifically for currency inflow transactions:
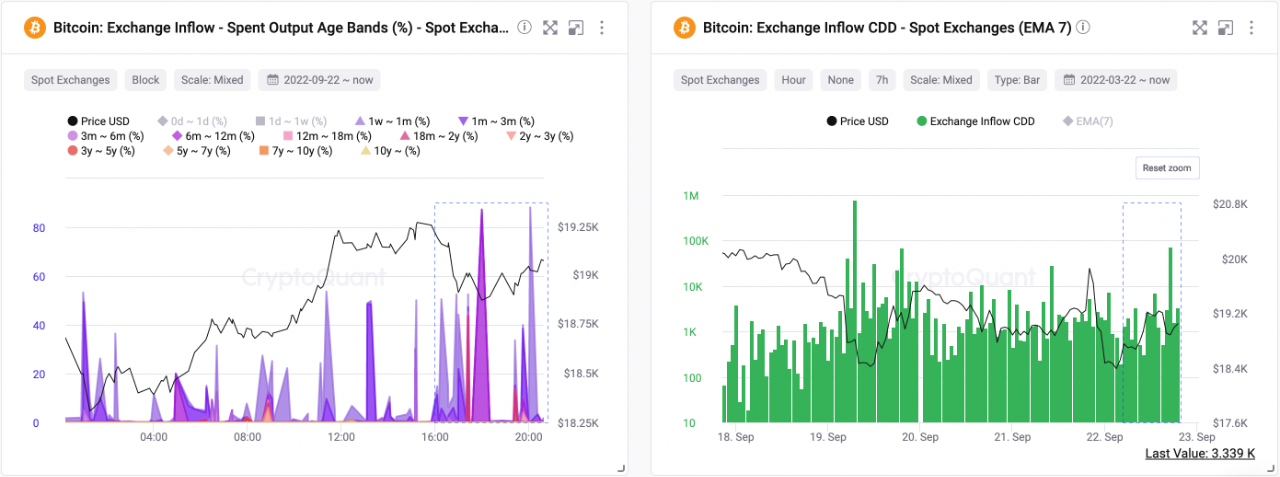
Looks like the 7-day EMA value of the metric has been elevated recently | Source: CryptoQuant
As you can see in the graph above, the Bitcoin exchange inflow CDD has observed a peak in the last day.
Since the indicator shown is only for the spot exchanges, these transactions were probably made for selling purposes, as that is what investors usually use these exchanges for.
Long-term holding group is a type of cohort in the BTC market that includes all those investors who hold their coins for a long time without selling or moving them, thus accumulating a large amount of coin days in the process.
As such, spikes in CDD generally suggest that old supply (that is, the supply held by long-term owners) is on the move. LTH sales have historically been bearish for the price of Bitcoin.
The last peak of a similar scale was seen just a few days ago, around which the coin price observed a short-term drop.
The chart also shows the trend in the age bands for input used output, which is an indicator that highlights the individual contributions to the supply coming from the different holder groups in the market.
It appears that a number of cohorts have shown movement of late, with long-term holders of 6-month to 12-month-old coins moving in particular.
BTC price
At the time of writing, Bitcoin’s price is hovering around $18.6k, down 5% in the last week.

BTC continues to be rangebound | Source: BTCUSD on TradingView
Featured image from Hans-Jurgen Mager on Unsplash.com, charts from TradingView.com, CryptoQuant.com


