Bitcoin aSOPR Profit-Loss Junction continues to act as resistance
On-chain data shows that the Bitcoin aSOPR profit-loss intersection has continued to act as resistance to the price of the crypto.
Bitcoin aSOPR bounces down from the breakeven line
As pointed out by an analyst in a CryptoQuant post, the aSOPR value equal to the ‘1’ line has acted as resistance for around 185 days now.
“Spent Output Profit Ratio” (or SOPR for short) is an indicator that tells us whether the average Bitcoin investor is selling at a profit or at a loss right now.
When the value of this metric is greater than 1, it means that the holders as a whole are moving their coins with a certain profit at the moment.
On the other hand, the indicator’s value being less than the mark suggests that the overall market is realizing losses at the moment.
Naturally, SOPR values exactly equal to 1 mean that the average owner just breaks even on his investment.
A modified version of the metric is the “Adjusted SOPR” (aSOPR), which excludes the transactions of all coins that moved again within just one hour of the last transfer from the data.
Now, here is a chart showing the trend of Bitcoin aSOPR over the last couple of years:
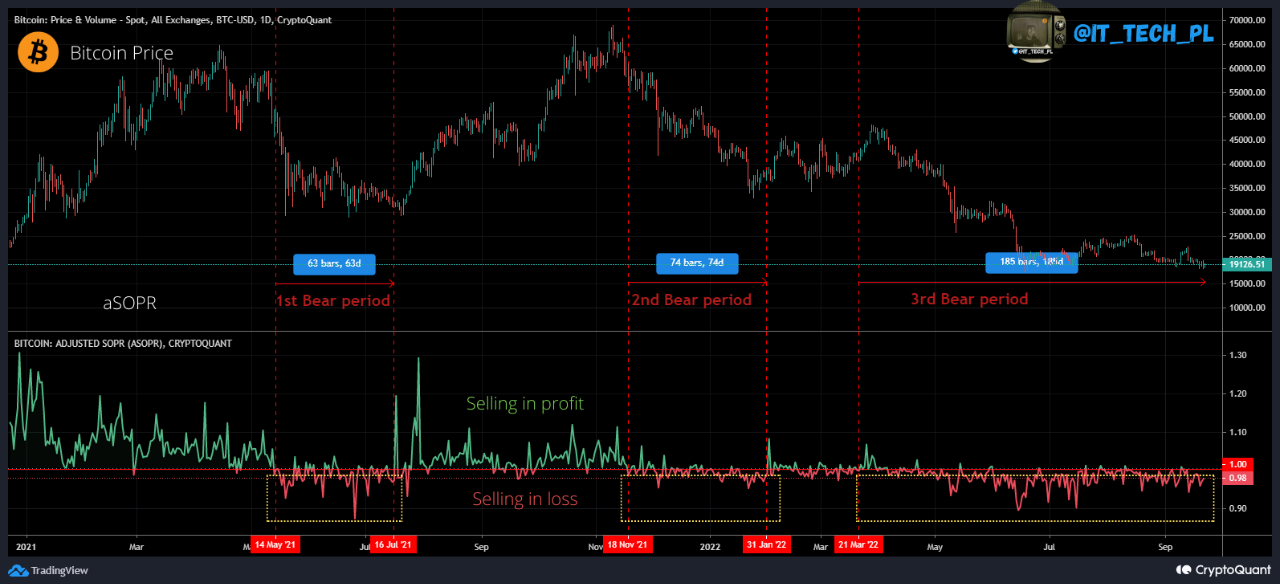
The value of the metric seems to have been in the loss region for a while now | Source: CryptoQuant
As you can see in the graph above, the quant from the post has marked the relevant trend zones for Bitcoin aSOPR.
In historical bear periods, the indicator has always found sharp resistance at the intersection between the profit and loss regions, and has thus remained locked below the 1 level.
Even in the current bear market, the metric has remained at values less than one. It has made several attempts to break into the end zone, but so far has been rebuffed each time.
The reason behind this is that aSOPR reaching a value of 1 suggests that investors, who were previously at a loss, are now selling at the same price as they entered. Psychologically, this appears to give these holders their money “back”. Therefore, a large amount of investors usually dump at this time, which provides resistance to the price.
In the past, proper breaks above the profit-loss junction have meant the start of a new bull rally. Since Bitcoin aSOPR is still trapped in the loss zone, it is safe to assume that the market has yet to see through this bear.
BTC price
At the time of writing, Bitcoin’s price is hovering around $18.8k, down 5% in the last week.

BTC has been moving sideways | Source: BTCUSD on TradingView
Featured image from Marco Pagano on Unsplash.com, charts from TradingView.com, CryptoQuant.com


