A look at Bitcoin [BTC] correlation score and its essence for investors
- There is an increasing convergence between Bitcoin [BTC] and traditional shares.
- However, Bitcoin’s correlation with the DXY remains uneven.
After falling for months beforehand, the price of Bitcoin [BTC] has increased since the beginning of the year. Despite the significant price increase, it has yet to return to the level that saw it reach $60,000.
Especially after the Covid-19 outbreak, Bitcoin’s price has correlated with traditional assets. How does the BTC correlation score stand now and what does it mean for cryptocurrency investing?
Read Bitcoins [BTC] Price prediction 2023-24
Explaining the Bitcoin Correlation Score
When comparing the price of Bitcoin to another asset or basket of assets, the correlation score can be used to measure the degree to which the two prices move in tandem.
To determine the correlation, we look at Bitcoin and the other asset’s price movements over time and see how closely they have tracked each other.
If the correlation score is -1, the values of the two assets are perfectly uncorrelated with each other; if it is zero, there is no correlation between the prices of the two assets; and if it is 1, then there is a perfect positive correlation between the prices of the two assets (meaning that the prices of the two assets move in the same direction).
To help diversify their holdings, investors can use the correlation score. Investing in several types of low-correlation assets helps reduce risk.
However, it is important to remember that correlation ratings can change over time. This highlights the need for constant asset correlation monitoring and subsequent investment strategy adjustments.
Bitcoin correlation score after Covid-19
Econometric data shows that after the Covid-19 epidemic, Bitcoin’s correlation score changed significantly. Some types of investments were selected for this study so that we could get a sense of the correlation score that is now available.
Stock market indices such as SP500 and NASDAQ, Bitcoin stocks such as MicroStrategy, Marathon, Coinbase and Block, US Dollar Index (DXY) and Eurodollar futures were selected to investigate whether they correlate with the price of BTC or not.
Well, interestingly, Ethereum and Dogecoin were also selected to check their correlation.
Prior to March 2020 (pre-Covid), stock market indices were largely unrelated to Bitcoin. After that, there is a consistent orange pattern, indicating a link.
As expected, Bitcoin has a strong relationship with other cryptocurrencies. The price of Bitcoin and gold have been highly correlated recently, despite their previous movements in and out of correlation zones.
Despite this, there has been zero correlation between DXY and Euro futures, either before or after the breakout. High correlation is marked in deep red, high anti-correlation is marked in deep blue, and no correlation is indicated in yellow.

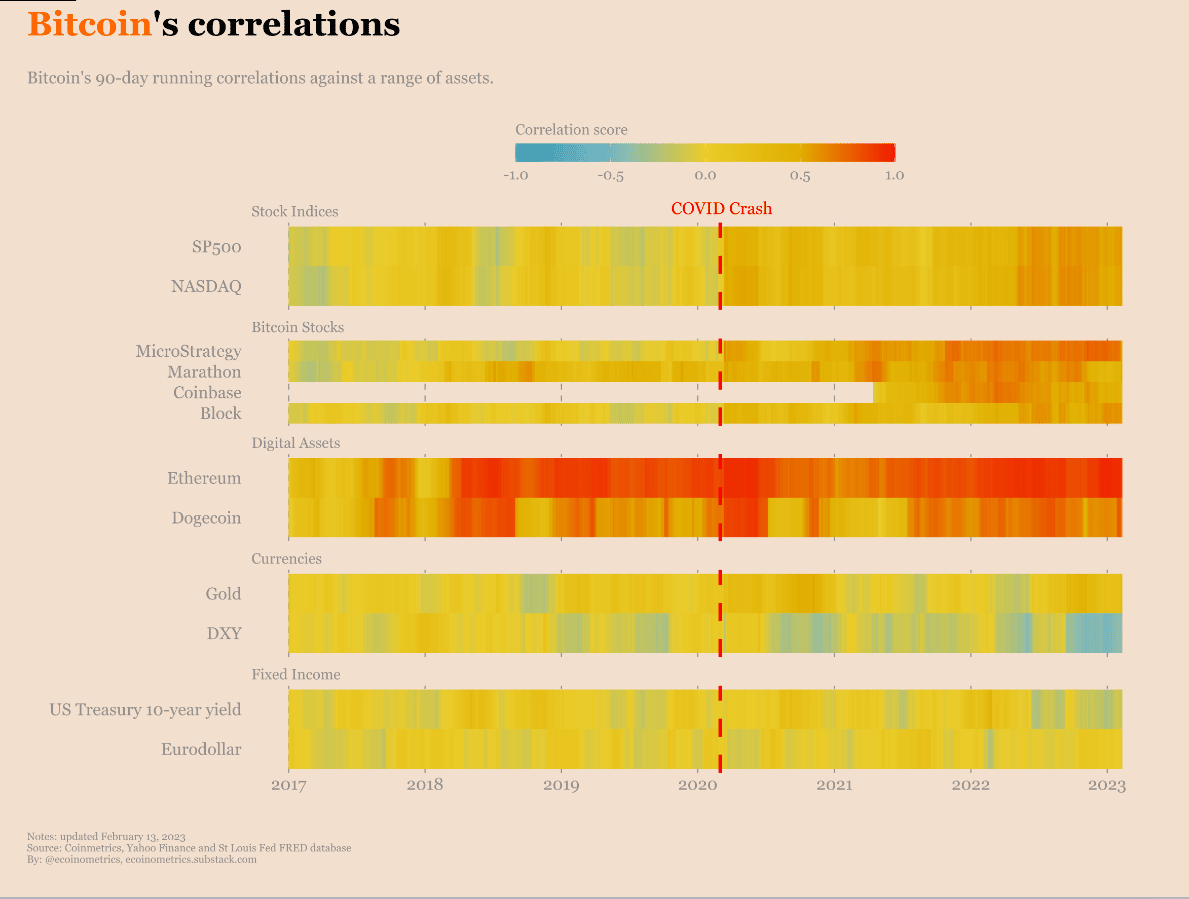
Source: Ecoinometrics
BTC price movement
The SP500, Nasdaq and the Bitcoin index revealed at the time of writing that they were all moving in separate directions.
The SP 500 and Nasdaq experienced losses, but they were less than 1%, while the Bitcoin index flashed green and recorded gains of over 1%. DXY, as well as euro futures, flashed green.
Is your portfolio green? Check out the Bitcoin Profit Calculator
Looking at the daily chart of BTC’s price action, we can see that it is trending upwards. A bullish trend was indicated by the Relative Strength Index line being above 60.
At the time of writing, the price of a single Bitcoin was just over $23,700. That also reflected a gain of more than 2% since the start of the trading day.

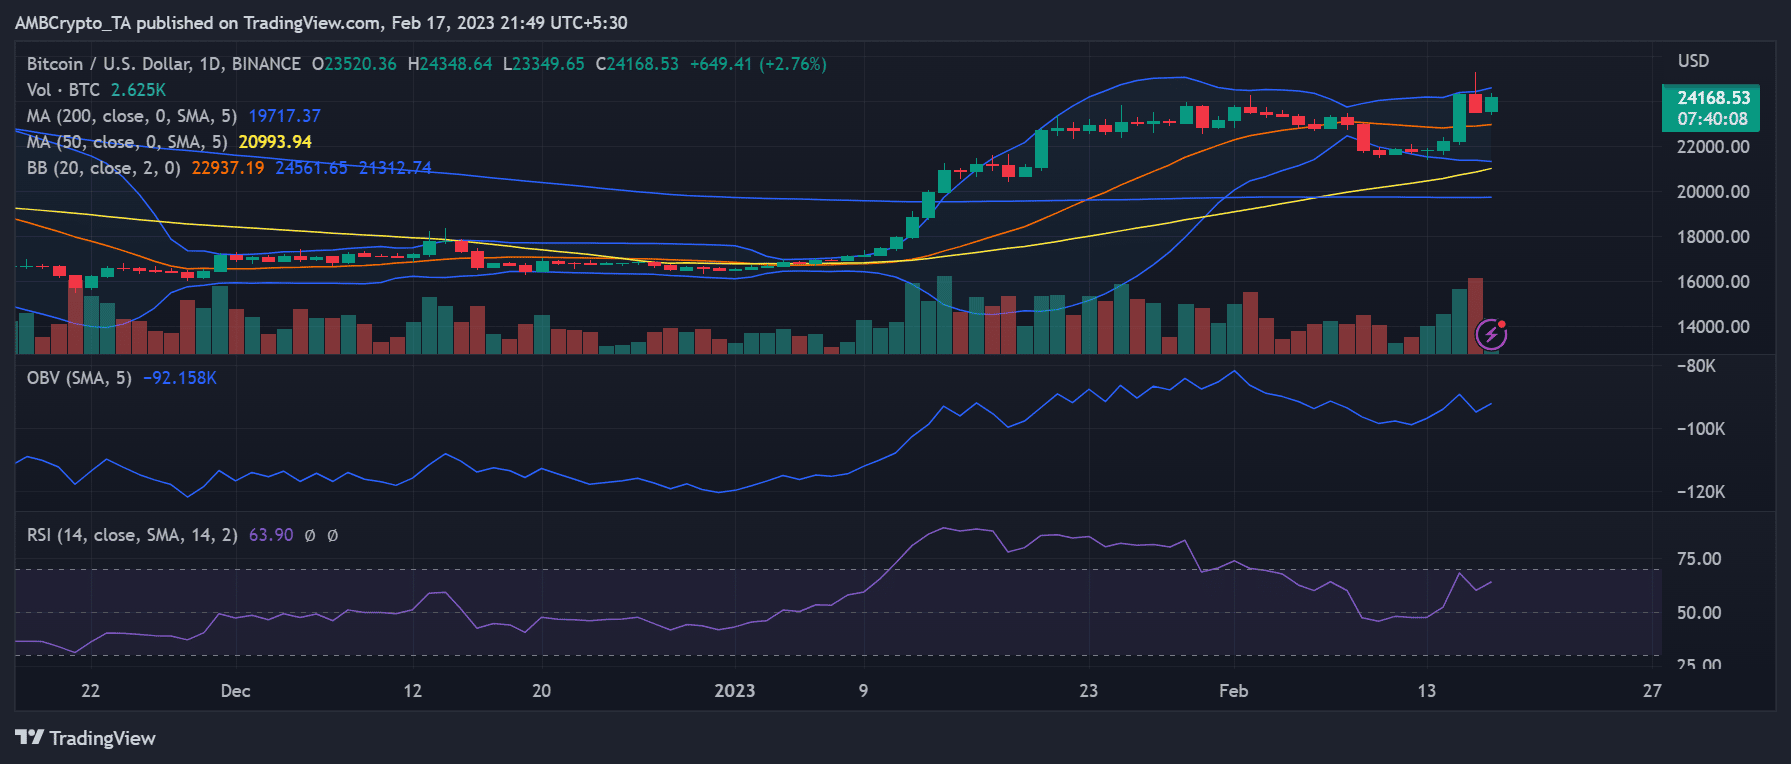
Source: TradingView


