4 indicators to analyze supply and demand of NFT collections
In a previous article, 5 indicators for smarter NFT trading, we looked at 5 general indicators to analyze sentiment and performance in the NFT market. This time we analyze NFT collectibles in terms of price behavior, holding patterns, rarities and leaderboards to understand supply and demand.
Indicators are not fixed rules for trading. They are a set of tools for building an overall picture of projects and trends.
Price is one of the most fundamental indicators for evaluating NFTs. There are 5 calculations you can look at.
Sale prices allow you to track the behavior of whales and see median, average and floor prices.
Most NFT buyers focus on the highest, average and floor price of a collection before buying. These calculations allow you to see at what price a commodity is likely to experience upside resistance. For example, the chart below shows that many users are entering Azuki at prices concentrated between 10 and 25 ETH.
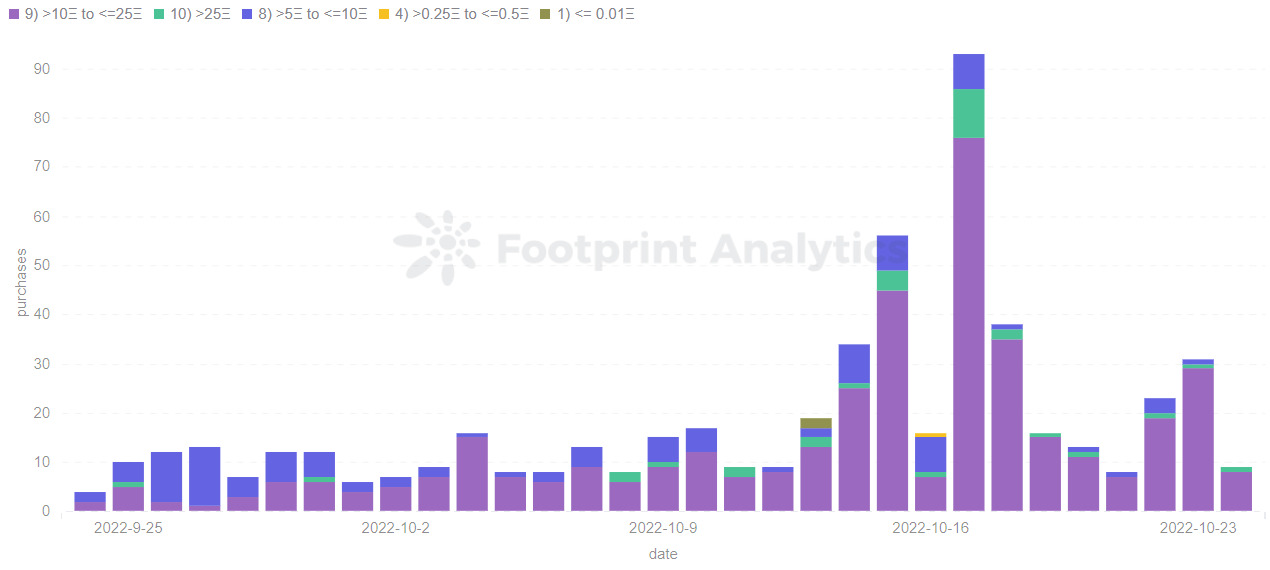
Footprint Analytics – Azuki Bucketed Sales, last 30 days
The floor price is the lowest price listed for the entire series of NFTs. Footprint Analytics shows that the BAYC series NFT has a floor price of 71 ETH, which is the lowest price recorded for a BAYC NFT in the market.
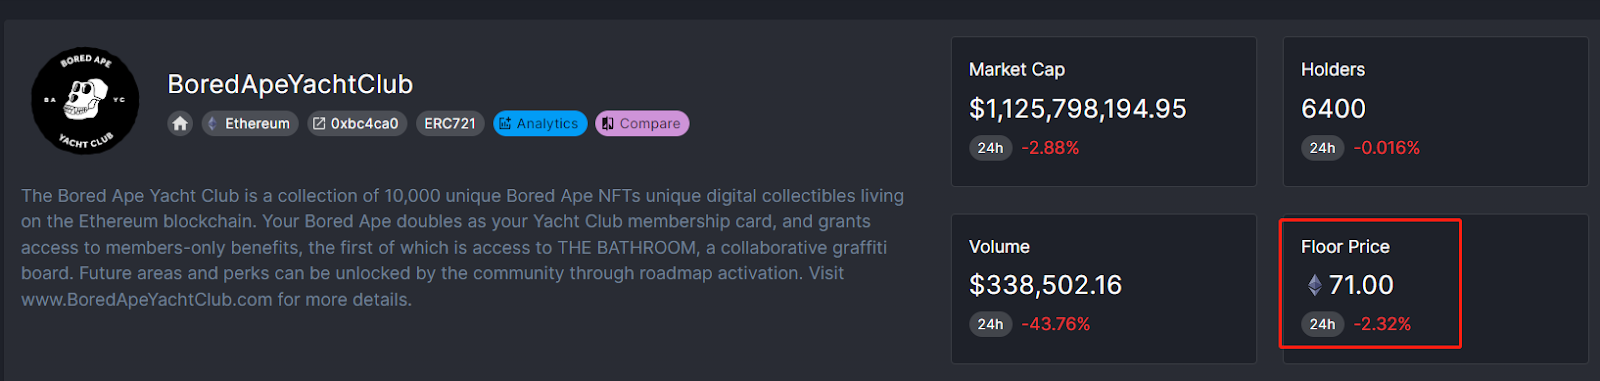
Footprint Analytics – BAYC Floor price
The fair value price for an NFT includes all the fees that must be paid, such as floor price, gas, creator fee and platform fee, to recover the original cost. By determining this, you can set a reasonable and profitable selling price.
The mint price of an NFT allows you to calculate the total income earned from a collection.
The royalty amount is the amount of royalty earned per transaction, and not all NFTs will have royalties. This price indicator is also primarily a calculation of the total income NFT has earned.
The rarity of an NFT collection refers to how small a collectible or NFT is based on certain characteristics. These features include the physical characteristics of the NFT, such as color and design. To analyzing an NFT collection for this indicator, a trader must watch NFT’s rarity score together with other useful information such as price, volume and liquidity. This indicator is linked to the inherent supply and demand of an asset.
An example of an extremely rare collection is Azuki, there is only 1 collectible with 5 traits. Conversely, a “regular” the set has 6 to 11 functions, with a total of 9,999 NFTs. Note that rarity is also an important indicator within collections, with rare characteristics increasing in relative value compared to the rest of the collection.
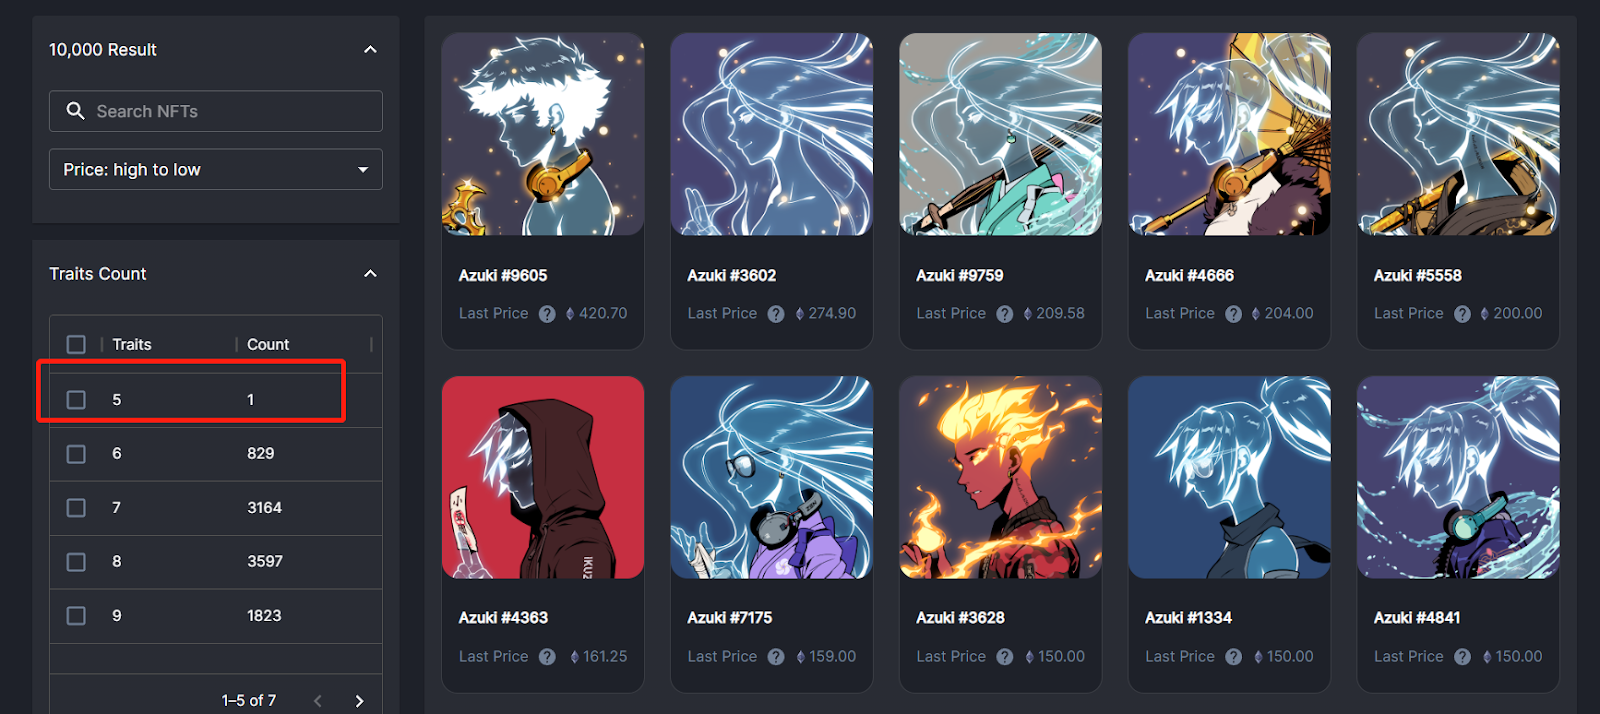
Footprint Analytics – Azuki collection
However, rarity is far from a 1-to-1 comparison. BAYC and CryptoPunks have the same rarity, but there are significant differences in their utility and vision.
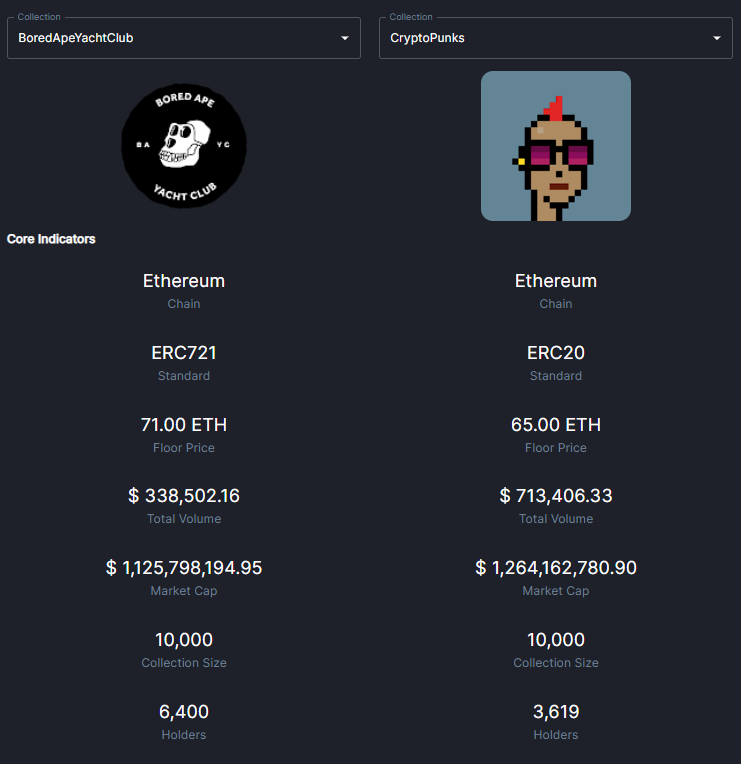
Footprint Analytics – Collection Compare
An important parameter used to determine the value of NFT is the number of addresses that hold it, a metric used to determine the size of the community around the project. This helps sell the project to a larger number of potential buyers.
Indicators such as which addresses are blue chip holders and whale holders can be assessed through the holders’ indicators.
Holders of at least one other blue-chip NFT, consider whether the NFT is popular among blue-chip holders, a higher percentage of blue-chip holders indicates a strong holder base.
Addresses with more than $1 million in assets are marked as whales. As shown in the figure below, different whale NFT holders can own 1 or more NFTs and their transaction volume will not increase due to the number of NFTs they own.
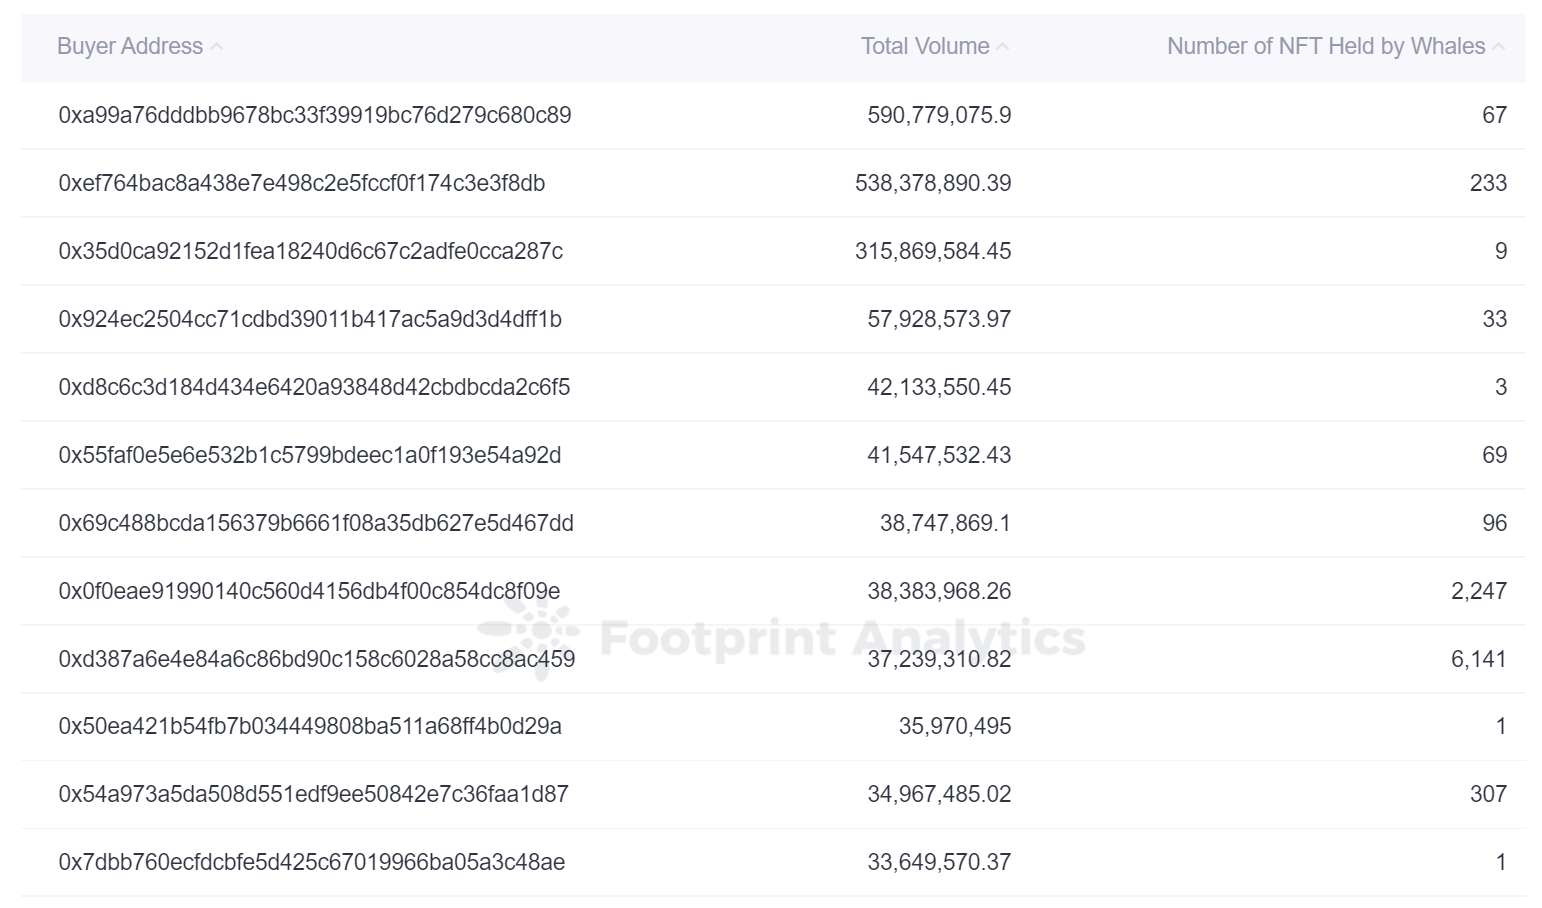
Footprint Analytics – Top 100 whales holding NFT transactions and volume
Use the leaderboard to find the best results wallet addresses and track their behavior. The calculations analyzed are as follows:
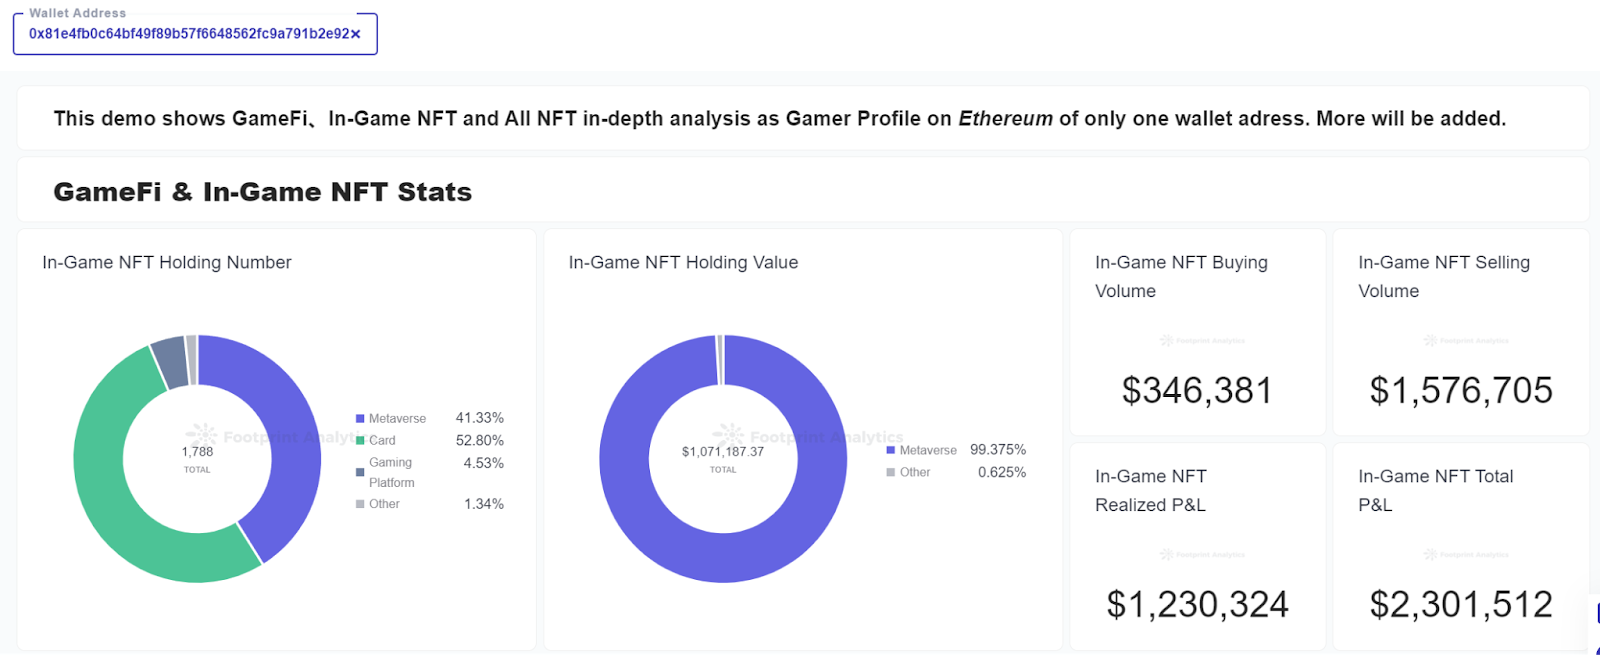
Footprint Analytics – Wallet tracking
- Profit and loss: Ranking of addresses with the highest profit
- Number of NFTs held: Ranking of addresses with the most NFTs
- Value of NFTs held: Ranking of addresses with the most valuable NFTs
- Volume of purchases and sales: Ranking of addresses with the highest volume of purchases and sales
Summary
Supply and demand is a core part of analyzing the value of any asset. Fortunately, NFTs give us a transparent view of supply by being in the chain, while other metrics can be used to infer demand.
This piece is contributed by Footprint Analytics society.
Footprint Community is a place where data and crypto enthusiasts around the world help each other to understand and gain insights about Web3, the metaverse, DeFi, GameFi or any other area of the new world of blockchain. Here you will find active, diverse voices that support each other and drive society forward.
Footprint website:
Disagreement:
Disclaimer: Views and opinions expressed by the author should not be considered financial advice. We do not provide advice on financial products.


