Bitcoin (BTC) Price at Resistance
Bitcoin (BTC) price has reached a key resistance area that had previously provided support since early 2021. Will bitcoin be able to break through this resistance or is it time for a correction?
Bitcoin price has risen rapidly since it validated its long-term resistance line as support in March. This created a long lower wick (green icon). Such wicks are considered bullish signs because sellers could not push the price down. Instead, buyers regained momentum and caused the price to close higher than the weekly lows. As expected, the BTC price has risen rapidly since then.
BTC reaches annual high
The following week, BTC broke out from the $24,500 resistance area and has now reached the $31,000 horizontal resistance. This is a very important area as it had previously acted as support since the beginning of 2021.
The Relative Strength Index (RSI) is increasing and is now above 50, indicating a bullish trend. RSI is a momentum indicator used to determine overbought or oversold conditions. An uptrend and a reading above 50 suggests that bulls still have momentum.
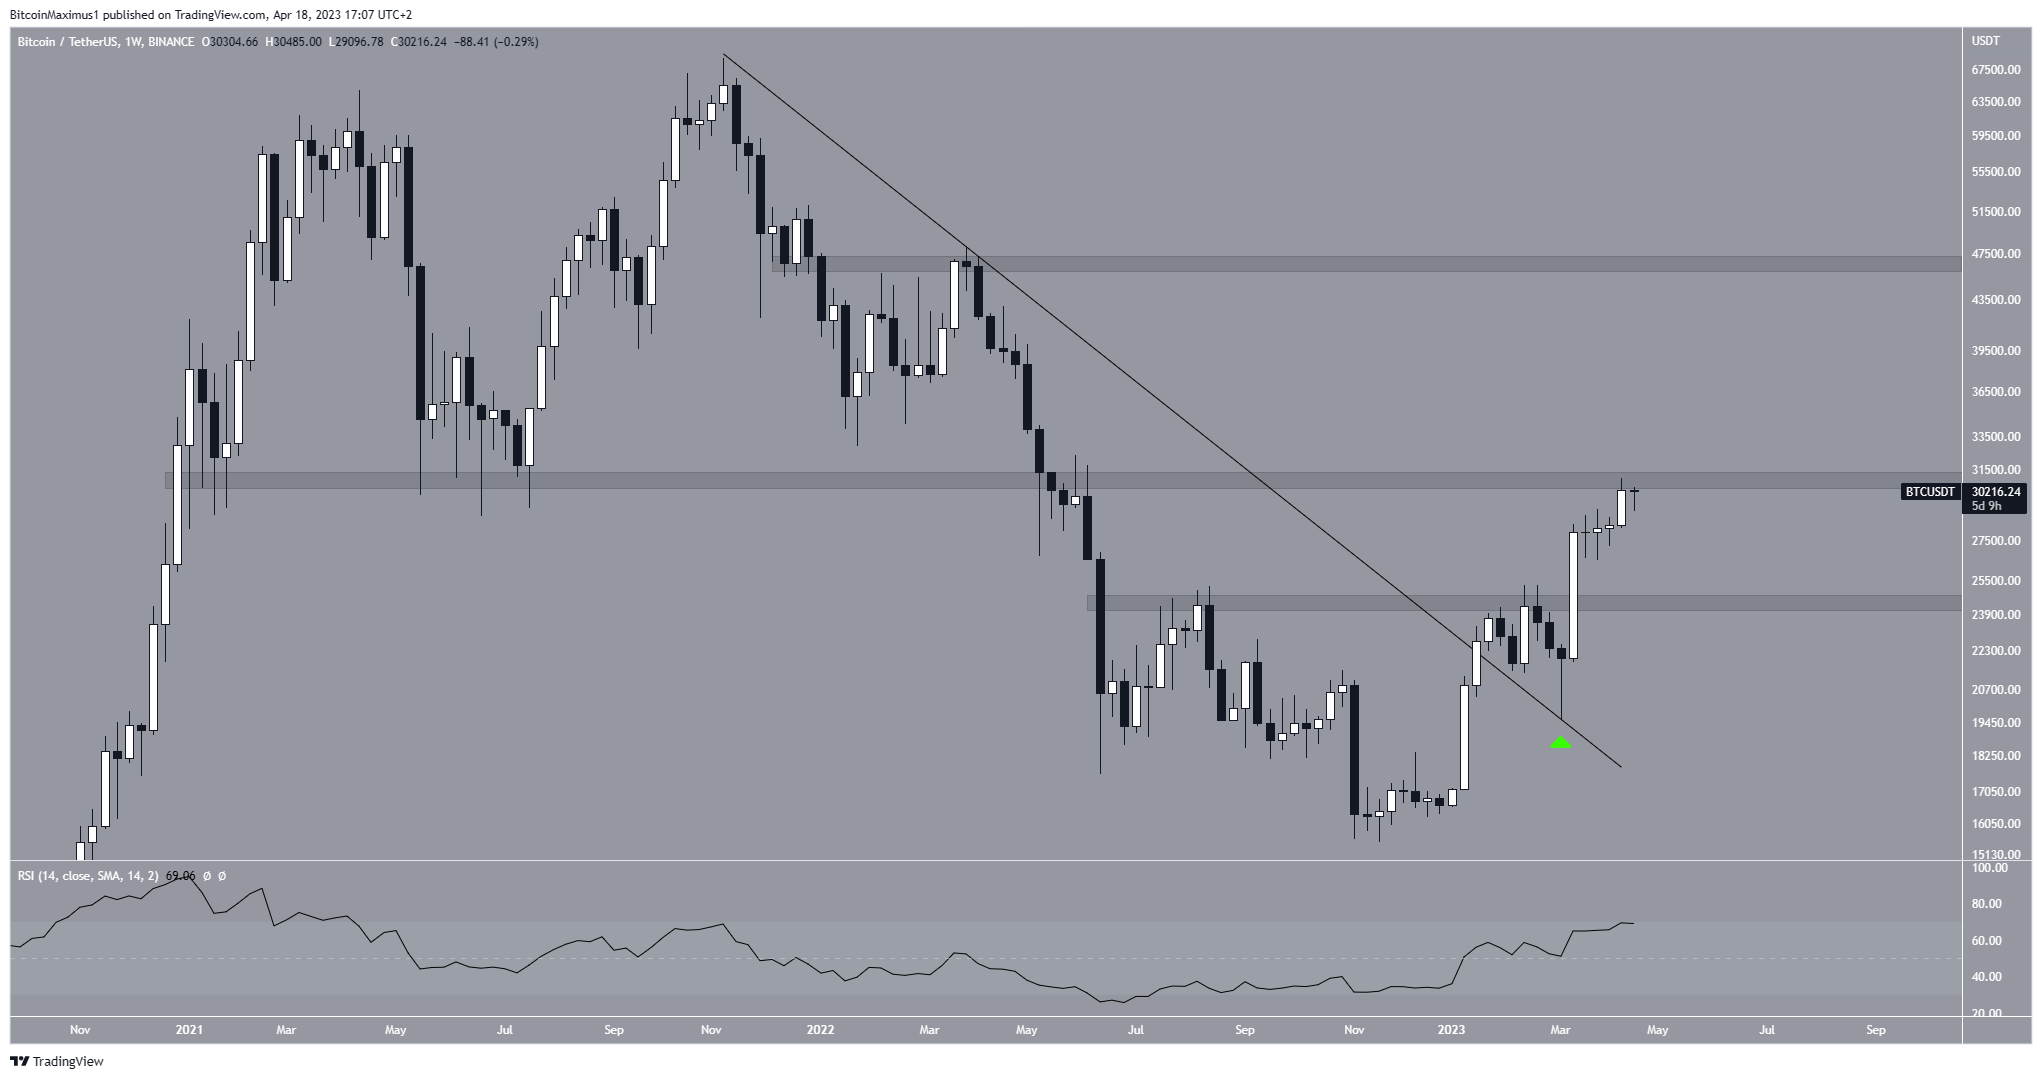
This supports the possibility that the price will clear the $31,000 resistance area and validate it as support. If so, the next resistance will be at an average price of $46,000.
On the other hand, a rejection from the $31,000 resistance area could lead to a drop to $24,500.
Bitcoin BTC Price Prediction: Will Price Clear $31,800?
The technical analysis from the daily timeframe provides a bullish BTC price prediction. It shows that the rate of increase accelerated after the price bounced at the 0.618 Fib retracement support level on March 10 (green icon).
Fibonacci retracement levels work on the theory that after a large price move in one direction, the price will retrace or retrace part of the way back to a previous price level before continuing in the original direction.
Since March 16, the digital currency has been trading in a rising parallel channel. These channels usually contain corrective structures, which means that an eventual breakout from it will be likely. Furthermore, the daily RSI has generated bearish divergence (green line). A bearish divergence occurs when a price increase is not accompanied by a similar increase in the RSI. That means momentum is slowing down and often precedes bearish trend reversals.
If the BTC price breaks out of the channel, it will invalidate the bearish divergence. Since that would also mean a breakout above the $31,000 resistance area, it would confirm the bull run in the process.
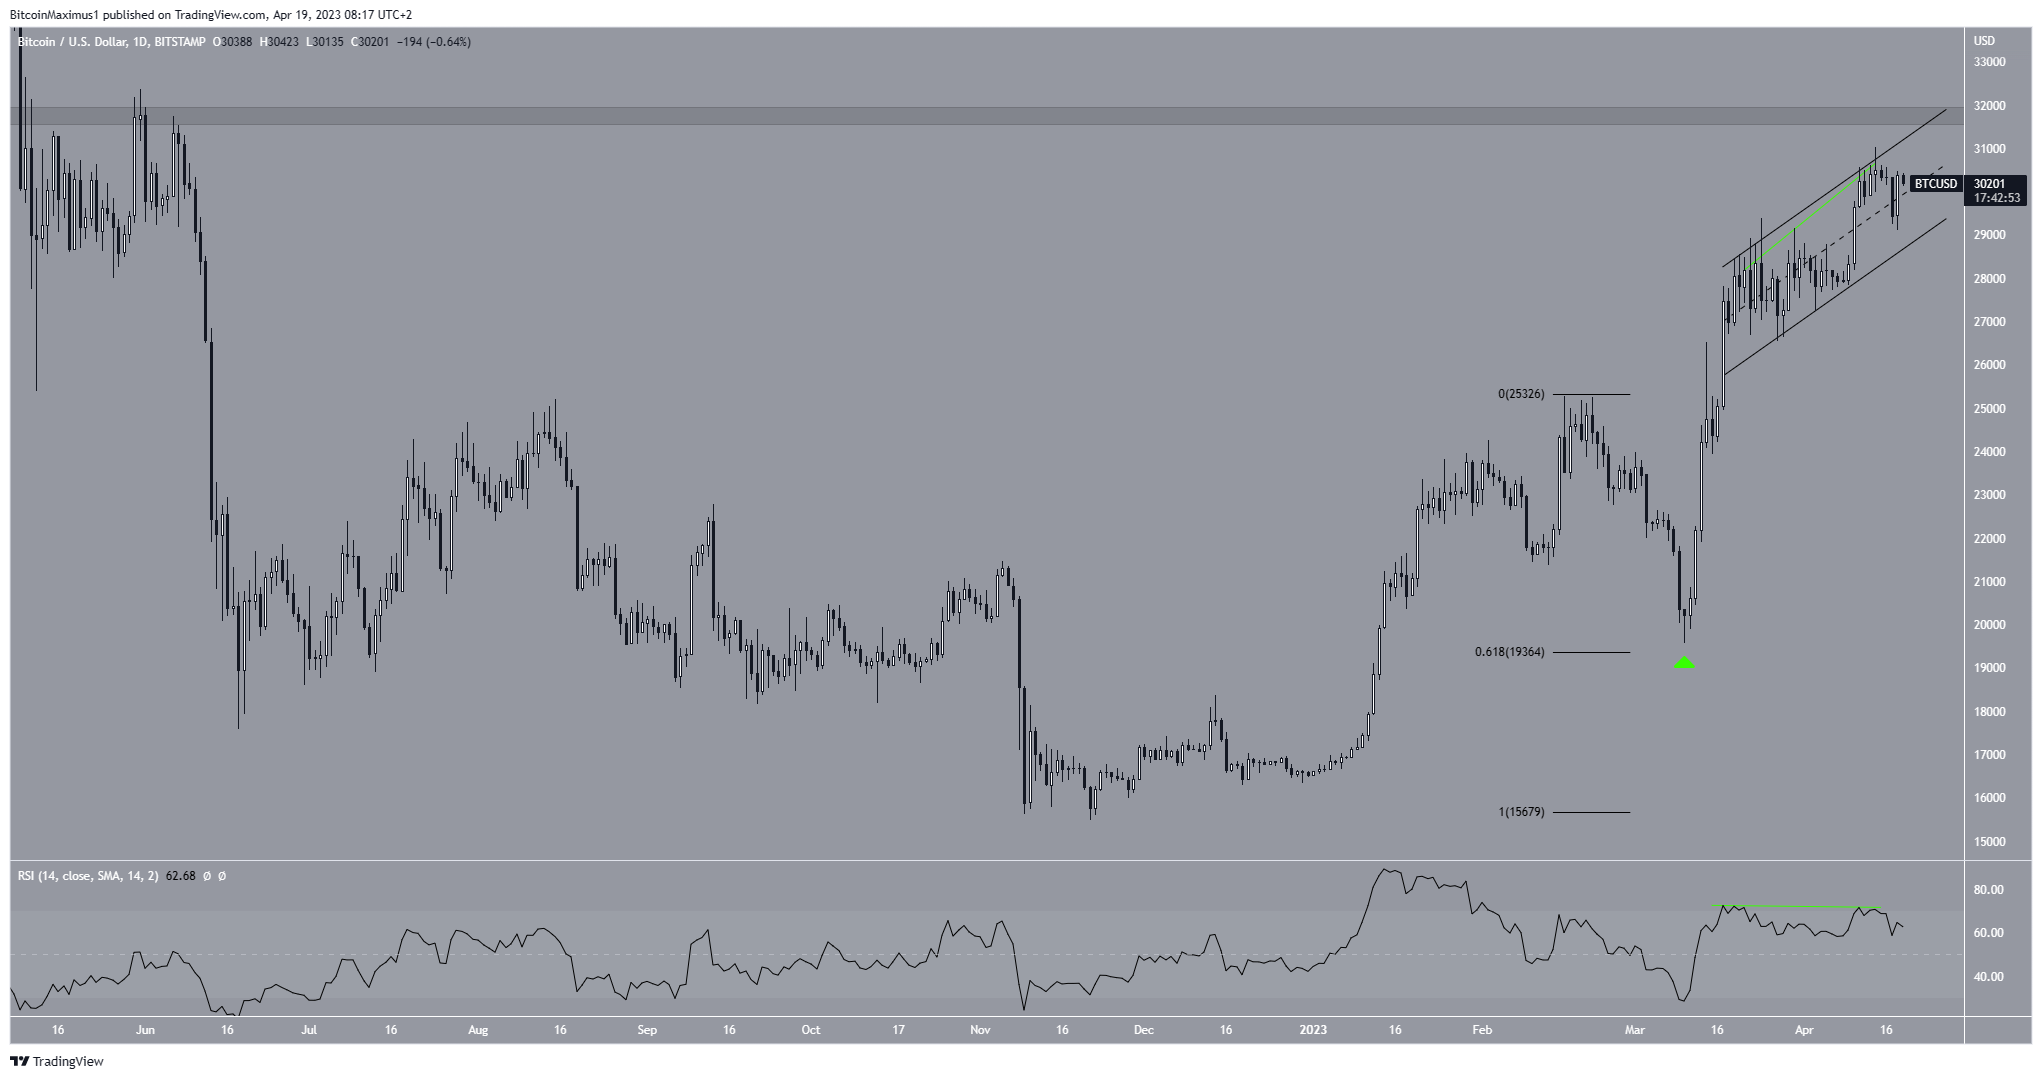
On April 18, BTC created a bullish engulfing candlestick. This is a type of candlestick where the entire decline from the previous day is negated the next day, and the price closes higher than yesterday’s opening. As a result, it supports the possibility that Bitcoin will break out and invalidate the bearish divergence in the process.
While a breakout from the channel could lead to acceleration of the upward movement towards $46,000, a breakdown from it would invalidate the bullish hypothesis and could lead to a drop to $24,500.
For BeInCrypto’s latest crypto market analysis, click here.
Disclaimer
In line with Trust Project guidelines, this price analysis article is intended for informational purposes only and should not be considered financial or investment advice. BeInCrypto is committed to accurate, objective reporting, but market conditions are subject to change without notice. Always do your own research and consult with a professional before making any financial decisions.

