How Bitcoin and Ethereum Compare to Global Currencies So Far in 2022

The cryptocurrency industry has historically been more volatile than either the stock or currency markets. However, since COVID there has been increased volatility for most investable assets. Interestingly, the pound fell by one of the sharpest rates in history after the recent mini-budget, while Bitcoin has remained relatively stable around the $19,000 market.
The stock correlation increases
The correlation between stocks such as the S&P 500 and Bitcoin is known to have increased drastically throughout 2022. The chart below shows that the correlation is near all-time highs and almost double that of 2020.
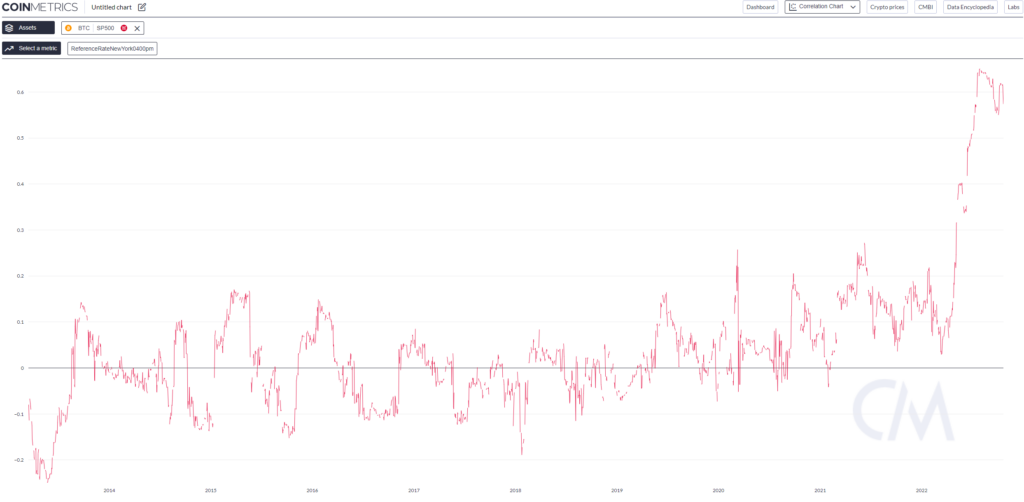
While the correlation between the S&P500 and Bitcoin has fallen since early October, it remains at around 0.57. But how has Bitcoin performed against currencies such as the dollar, pound, euro, yen and other major currencies?
October comparisons with global fiat currencies
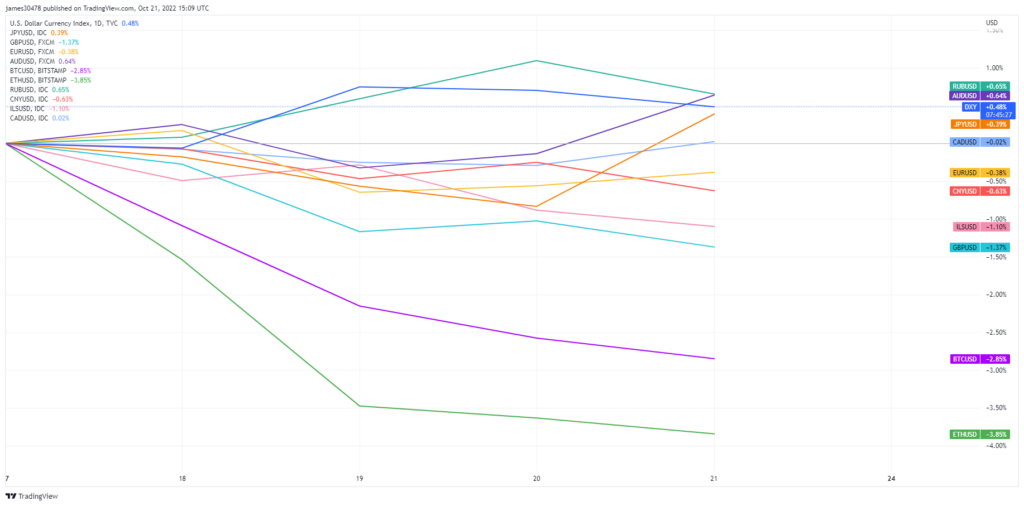
Since October 7, both Bitcoin and Ethereum have seen declines of 2.85% to 3.85% respectively. While the British pound, euro, Chinese yuan and Israeli shekel also fell to 1.37%, the US dollar, Australian dollar, Japanese yen and Canadian dollar rose to 0.65%.
The data thus shows that the volatility in the crypto markets is slightly outside the old currency market, but not by as large a margin as some might expect. For a global fiat currency to lose 1.37% of its value in 14 days is alarming, but for Bitcoin a 2.85% decline is mild to what many are used to seeing.
Quarterly comparisons with global fiat currencies
The diagram for the last quarter of 2022 (since August) gives a broader picture of the situation. Ethereum has seen the most volatility in Q3, while the US dollar has remained relatively flat and consistently strengthened since late August.
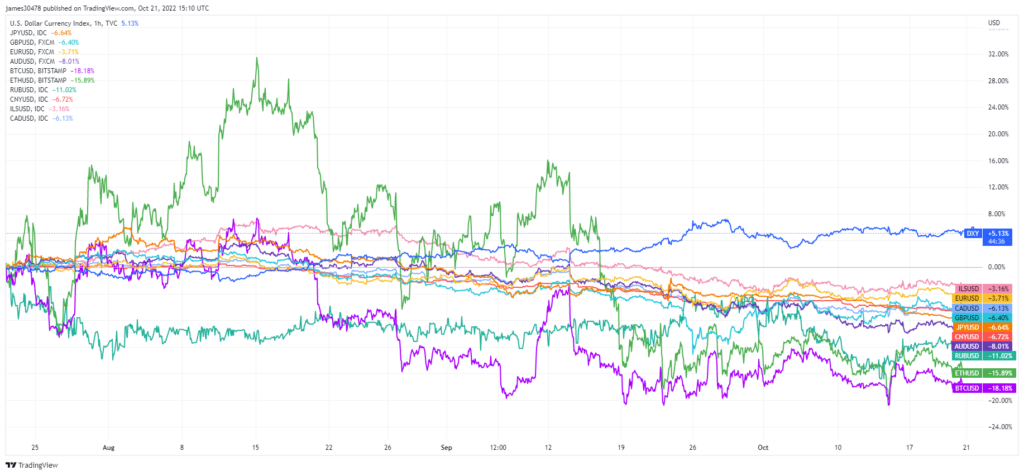
Bitcoin has seen a more significant decline than Ethereum over the period, but less volatility. The volatility of all other currencies has followed a similar trend since mid-September.
Year-to-date comparisons with global fiat currencies
Taking the whole year into consideration, the standout winner is the US dollar which has seen a 16.97% increase in value with a steady rise in price without much volatility. The Russian ruble recorded a 21.09% year-to-date gain after a 45% decline in March. The ruble has had an extremely volatile year, but ends Q3 solidly in the green.
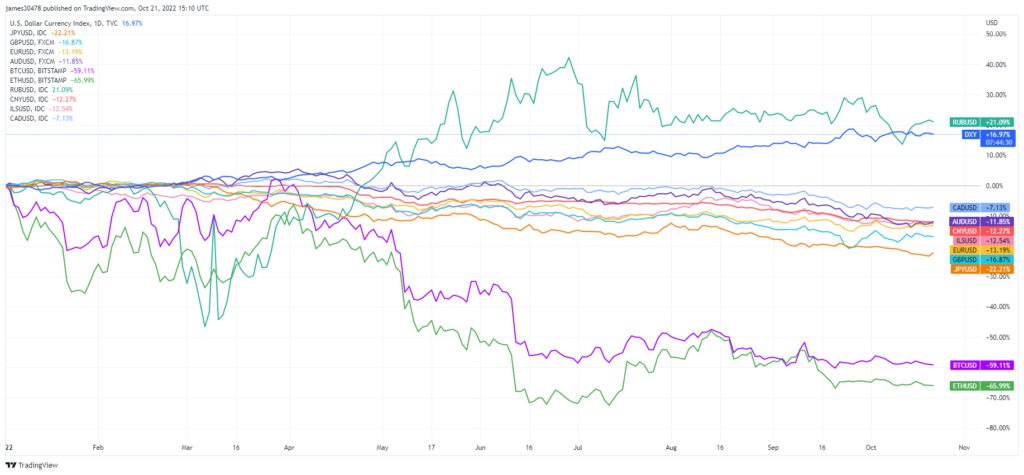
Bitcoin and Ethereum both recorded heavy losses since January, with the pair down 56.11% and 65.99% respectively. An even more accurate picture of the decline in volatility within crypto can be seen in the year-to-date chart. Mid-September and beyond have two of the smoothest lines on the chart for Bitcoin and Ethereum.
Annual moves in crypto are far worse than traditional currencies. Of the basket inspected, the biggest losers were the British pound, down 16.87%, and the Japanese yen, down 22.21%. However, all currencies except the US dollar and the Russian ruble are following a 6-month downward trend in value.
What the reduction in volatility might mean is up for debate; the maturity of the crypto markets, a bear market bottom and the calm before the storm – all are reasonable theories. However, the correlation between crypto, equity and global fiat currency markets has never been so aligned. Past performance is unlikely to guide traders through such an unknown period, so CryptoSlate publishes research reports like these daily. Readers can find more research reports here.