Bitcoin Records Massive Volume Increase; End of the bear market in sight?
The cryptocurrency sector seems to be finally getting a breather after a chaotic period for most of its assets, including Bitcoin (BTC), which recently recorded a massive increase in weekly trading volumes, indicating a possible price advance in the near future.
Specifically, two weeks before, Bitcoin recorded “the strongest weekly volume in more than a year, driven by the collapse of FTX,” according to an analysis by the experts of the crypto analysis firm TradingShot, published November 22.
As the analysts explained, “such dramatic increases in volume tend to be associated with trend reversals on BTC.” Furthermore, they specified that this means that the price can move significantly in either direction:
“Especially in the last price action, we have had a similar volume increase on 13 June 2022. Practically the same volume increases between a 5-month period. As this chart shows, volume increases in such a period or shorter have historically been either bottom or top formations.”
Previous patterns
In terms of forming the bull cycle top, a similar volume pattern was noted between January 11, 2021 and May 17, 2021. On the other hand, a bear cycle bottom formation coincided with a volume increase in the period from November 19, 2018 to May 13, 2019.
Prior to that, a bull cycle top was formed between December 18, 2017 and February 5, 2018, with a large volume increase that was preceded by the one that occurred during a bear cycle bottom formation between January 12, 2015 and November 2, 2015.
As TradingShot observed the team, the most recent pattern had the most similarities to the one that took place between June 13, 2022 and November 7, 2022, and involved a trend line with lower tops (bottoms), leading them to hypothesize a possible bullish trend reversal:
“Could the November 07 surge in volume be the moment that causes the trend to reverse and get Bitcoin out of this two-year Bear cycle, or is it simply a short-term rally, at best, like June 13, 2022 and February 05, 2018, volume increases?”
Bitcoin price analysis
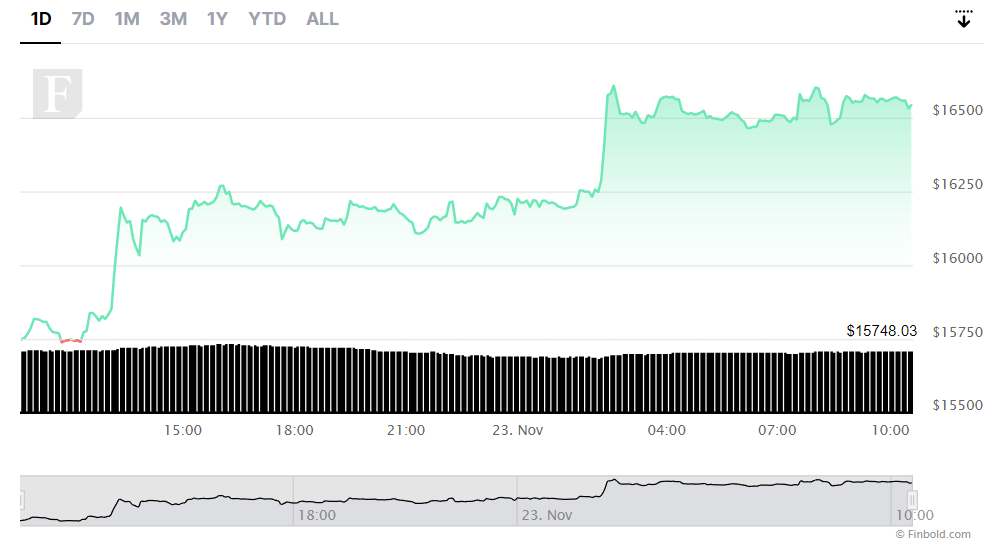
Considering the current chart patterns that Bitcoin is forming, a bullish future may indeed be in the cards. At press time, the flagship decentralized finance (DeFi) token was moving towards the key resistance level of $16,600 which crypto trading expert Michaël van de Poppe identified as leading towards further strengthening.
Specifically, Bitcoin is changing hands at the price of $16,536, representing a gain of 5.20% over the previous 24 hours, although it is still down 1.08% for the week and a loss of 14.86 % in the month, according to the data obtained on 23 November.
On top of today’s improvement, the largest cryptocurrency by market capitalization ($317.74 billion) has historically demonstrated one last bullish push during the approaching Thanksgiving holiday, although this year’s trend may be interrupted, based on various technical analysis (TA) indicators .
Disclaimer: The content of this page should not be considered investment advice. Investment is speculative. When you invest, your capital is at risk.


