What Wall Street doesn’t want you to know pt.2
- Bitcoin Price Shows Smart Money Accumulation Signals. A bottom may be near.
- Ethereum price is likely to witness an influx of volatility, a swing trader’s approach may be the most appropriate.
- Ripple price remains in a bearish stronghold based on recent bearish influence.
Part two of an Elliott Wave, on-chain technical and analytical treatise used to measure current market behavior and predict the next directional movements in the crypto market.
Bitcoin price looks bullish under the hood
Bitcoin price is currently trading at $19,982. The recent breach of the $20,000 barrier has many analysts calling for a sweep-the-lows event at the June 18 low of $17,622. From a technical point of view, the call is justified. The volume profile shows a rise near the top of the August bullrun, signaling the involvement of smart money. In addition, the bears have persistently rejected Bitcoin’s re-entry of the $20,000 barrier on intra-hour time frames.
Nevertheless, a few analysis tools in the chain convey a different message. For example, Santiment’s 365-day Bitcoin Circulation chart shows a massive decline in annual circulating tokens. There are currently 5.96 million tokens in circulation, which is the lowest reading in the last six years. The last time this amount of tokens was in active circulation was in 2016, when Bitcoin traded for $5,711.
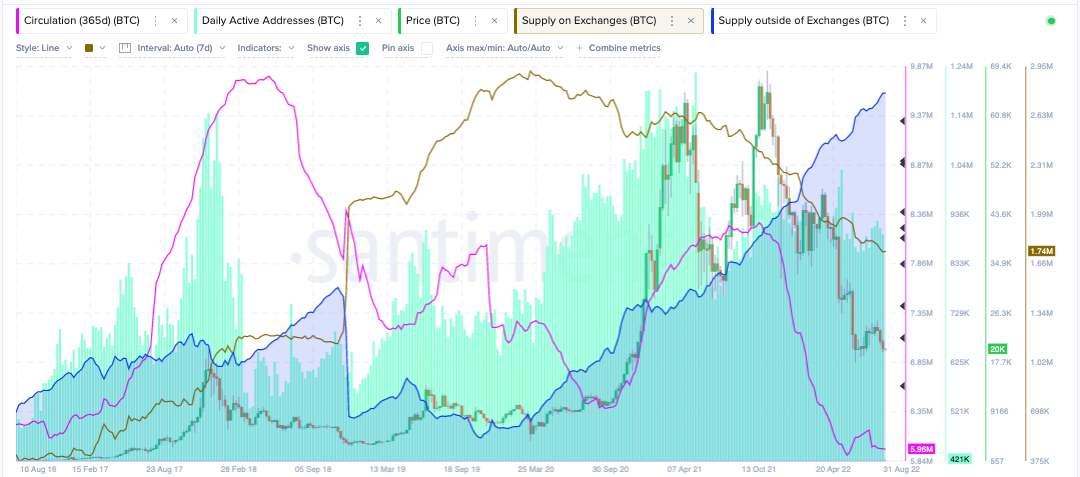
Santiment’s price, 365-day circulation supply on and off stock exchange indicators
The indicator of the total Bitcoin supply on all crypto exchanges continues to fall. At 1.74 million currently, exchanges have the lowest amount of liquid Bitcoins since October 2018, just before Bitcoin fell from the $6,000 to $3,000 lows.
Finally, the Supply Outside of Exchanges indicator goes parabolic. With a new all-time high of 2.75 million Bitcoins, this indicator suggests Whoever buys Bitcoin is uninterested in short-term gains. In theory, the lower supply of tokens on exchanges creates more demand for the token among private and institutional investors.
In the following video, our analysts dive deep into the price action of Bitcoin, analyzing key levels of interest in the market. -FXStreet Team
The Ethereum price tells a different story
Ethereum price has outperformed Bitcoin this summer by almost 150%. Compared to Bitcoin’s 42% rally, the decentralized smart contract saw a 126% increase since its June 18 liquidation.
The ETH price is currently auctioned at $1,571. The technicals are showing a decline in volume amid the current selloff, which is an optimistic signal of more gains to come.
Still, on-chain analytics tools suggest that ETH will have trouble repeating its impressive performance. Unlike Bitcoin, Santiment’s Total Supply on Exchanges indicator is actually turning to the upside.
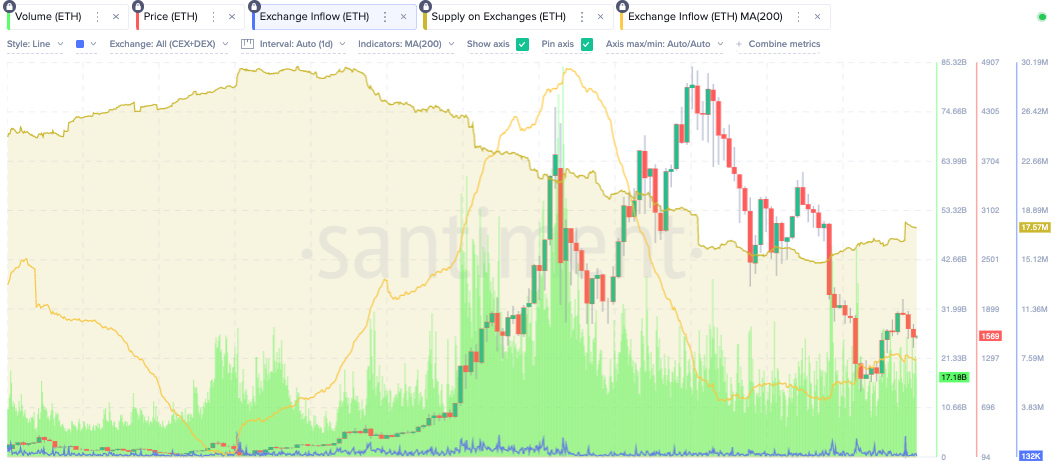
Santiment price, volume, 365-day circulation supply on stock exchanges indicators
Currently at 17.6 million tokens, the last time Ethereum inventory was this high across all exchanges was in November 2021, when the ETH price was auctioned between $4,200-$4,600.
In theory, the indicator suggests that the Ethereum price could be a volatile token that is ideal for day traders in the coming weeks. However, new all-time highs will be more difficult to achieve than for its Bitcoin counterpart.
In the following video, our analysts dive deep into the price action of Ethereum, analyzing key levels of interest in the market. -FXStreet Team
Ripple price remains in bearish limbo
The XRP price is currently auctioning at $0.325 as the digital remittance continues to underperform its peers. Since June, the digital remittance token has increased by 35%. What once appeared to be a profitable consolidation near $0.37 ended up turning into a total selling frenzy, with the Ripple price falling 10% in one day on August 19th.
The bearish August 19 engulfing candle is now the biggest candle of the summer, suggesting that the bears are now in control. The volume profile indicator gradually increases in transactions in the middle of each market decline. Finally, the XRP price has witnessed a rejection from both the 8- and 21-day simple moving averages, which is likely to entice sideways bears to jump in for more downside potential.
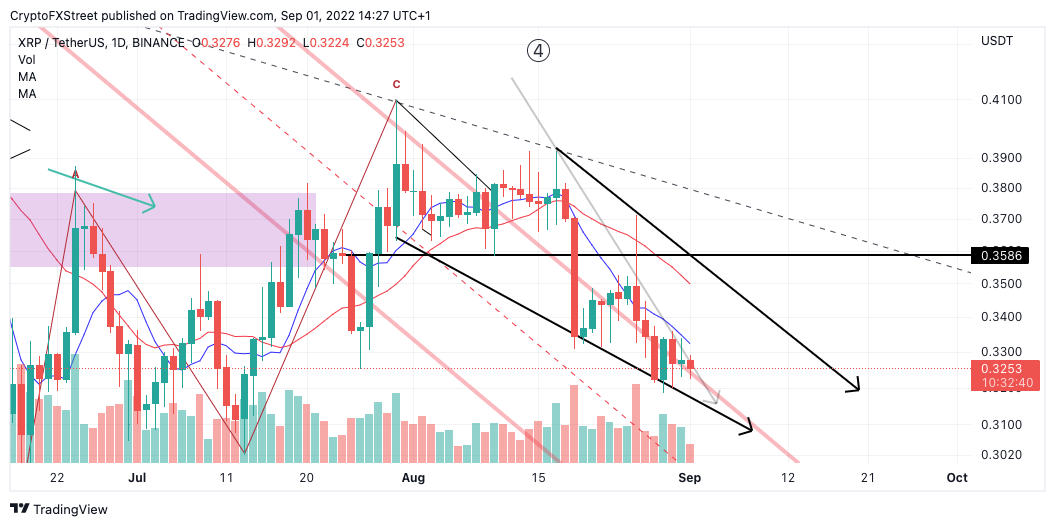
XRP/USDT 1-Day Chart
Combined, the XRP price could unleash a whirlwind of pain in the coming weeks. The bears are likely targeting targets between $0.28 and $0.24. Traders looking to join the trend should hold an invalidation point above $0.41.
Traders should be wary of placing an entry too early, as closing a candle above $0.33 at the daily level could catalyze a sharp rally towards $0.37 in the short term.
In the following video, our analysts dive deep into the price action of Ripple, analyzing key levels of interest in the market. -FXStreet Team


