Weekly Waves: EUR/USD, Bitcoin and Gas
-
EUR/USD remains trapped between 0.95 support level and parity (1.00) resistance zone
-
A bearish breakout (orange arrow) below the support zone (blue) could confirm a drop towards the $15k and $12k support zones.
-
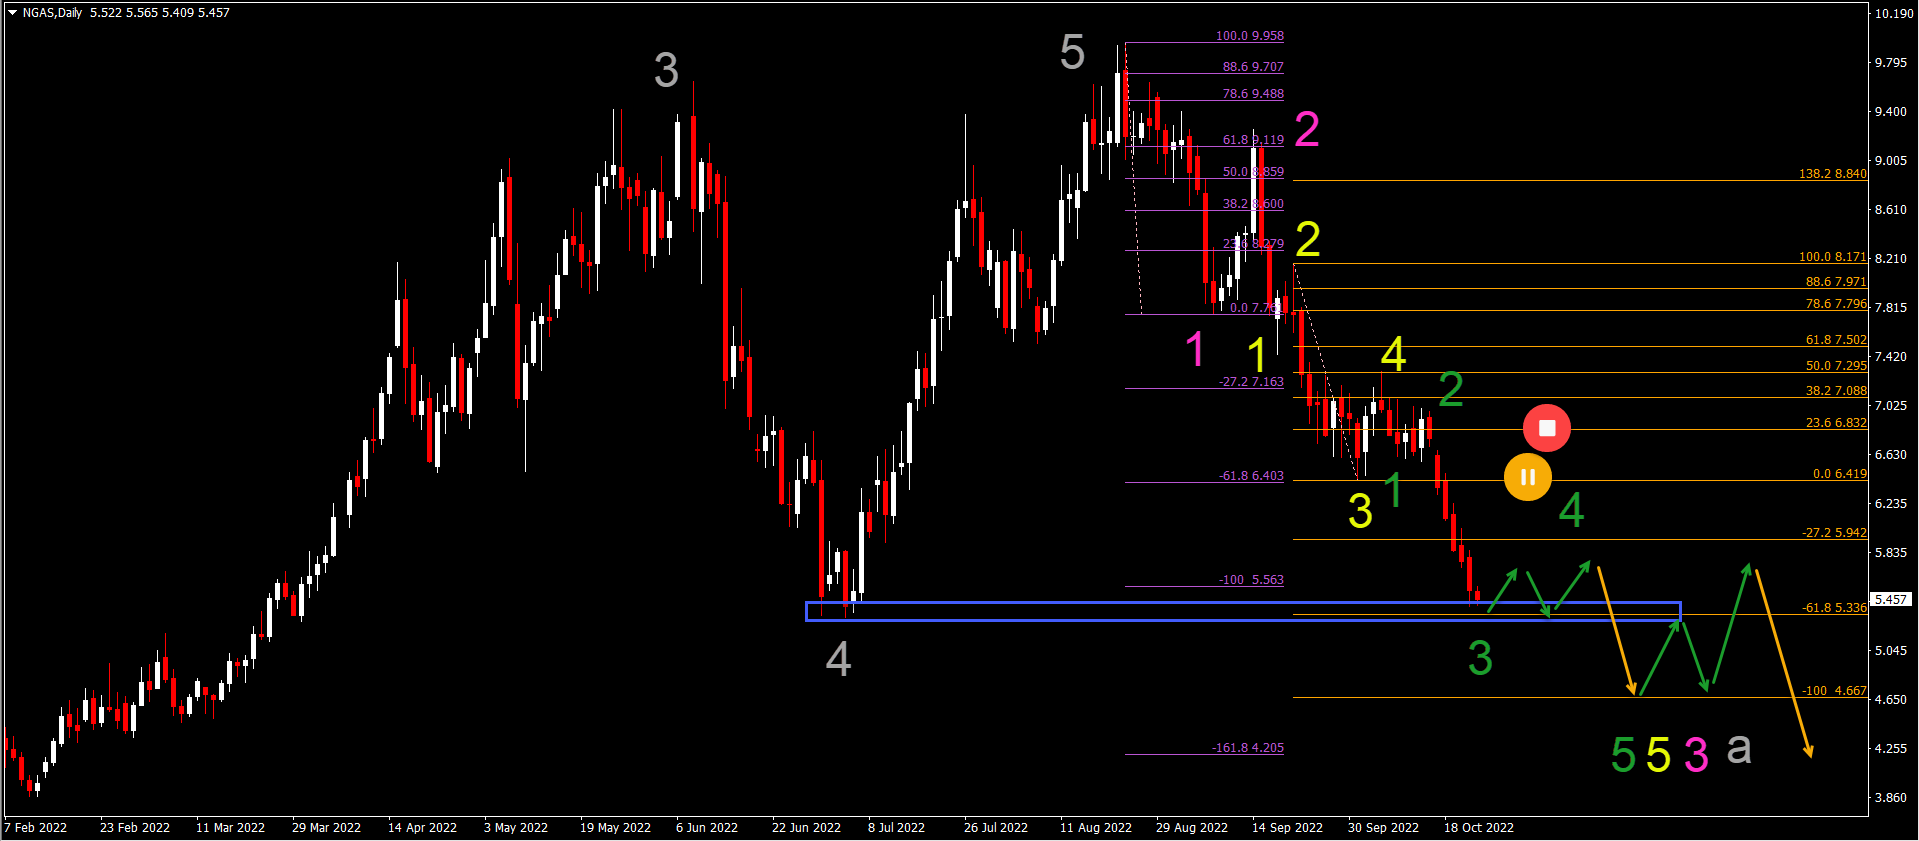
NGAS is quickly dropping lower as we expected last week. The bearish decline has been marked as a wave 3 (green).
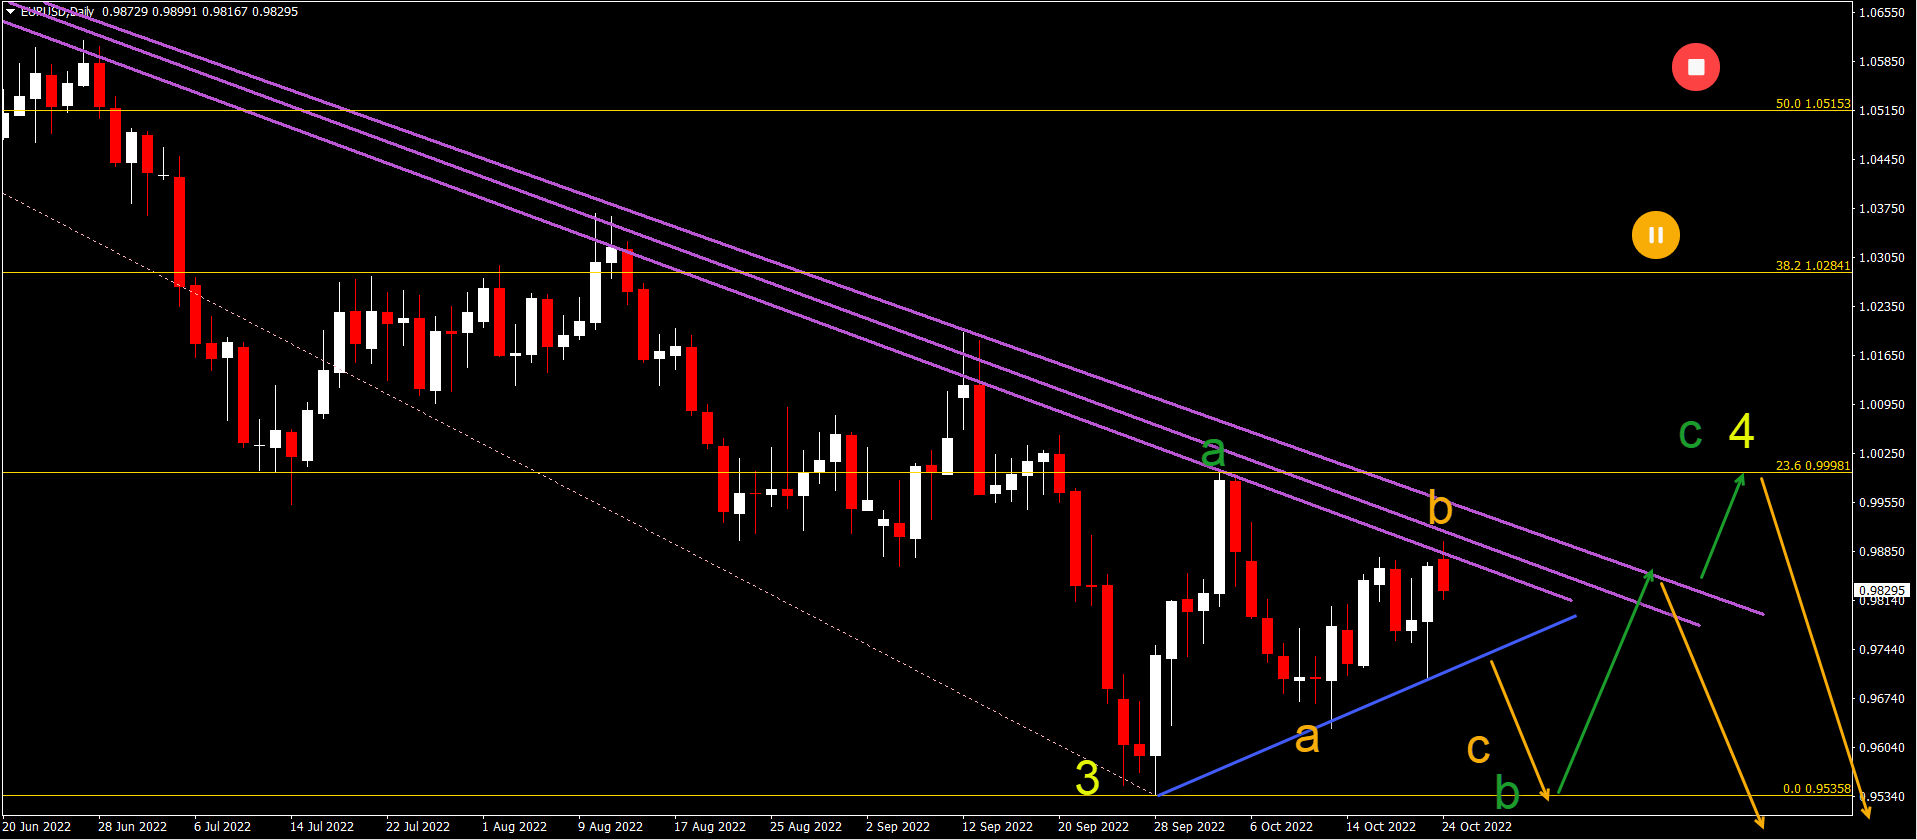
EUR/USD caught between 0.95 and 1.00
EUR/USD remains trapped between 0.95 support level and parity (1.00) resistance zone:
-
EUR/USD made a bullish bounce (wave A orange) as expected.
-
But the bullish recovery was milder than we expected. Therefore, we changed the expected Elliott Wave pattern to a bearish ABC (orange).
-
Another bounce at the previous low near 0.95 could confirm the end of wave B (green) and the start of wave C (green).
-
Wave C may end up as a bullish 5-wave pattern closing on the previous peak near the 23.6% Fibonacci level.
-
A downtrend is expected to continue as ABC (green) completes wave 4 (yellow).
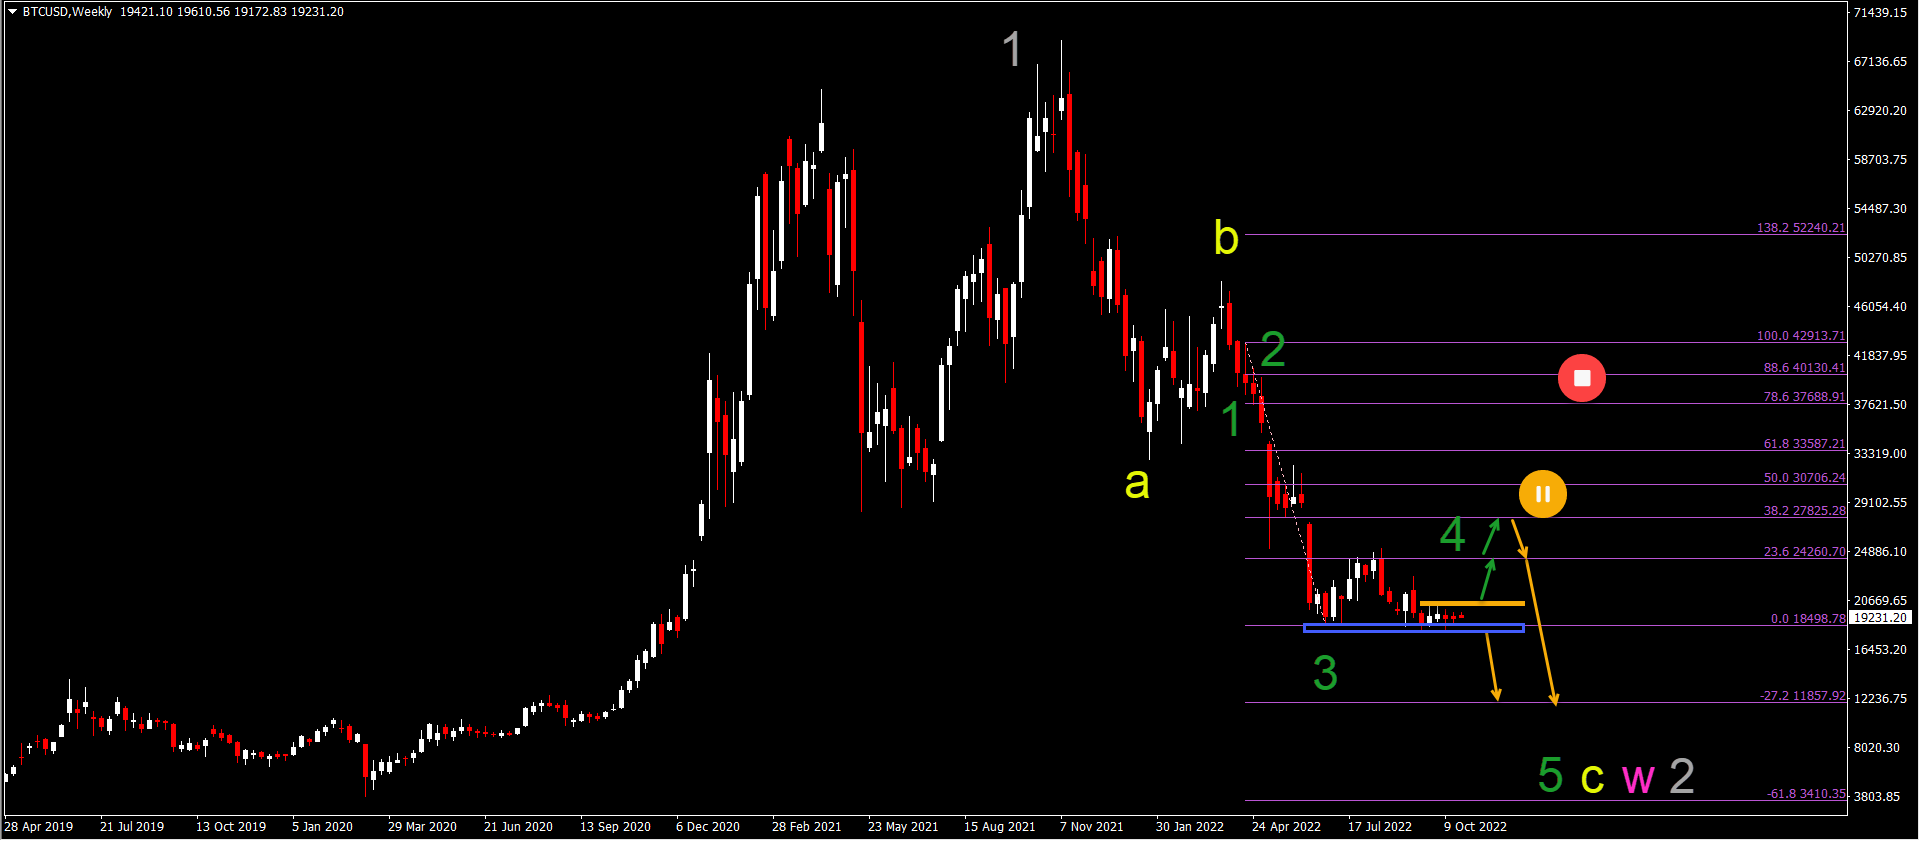
Bitcoin
Bitcoin (BTC/USD moves sideways between $19k and $20 resistance:
-
BTC/USD is waiting for a break up or down.
-
A bearish breakout (orange arrow) below the support zone (blue) could confirm a drop towards the $15k and $12k support zones.
-
A bullish breakout (orange arrows) above the $20 resistance zone (orange) could indicate a pullback towards the 23.6% and 38.2% Fibonacci levels.
-
A deeper bullish upward push puts this bearish Elliott Wave analysis on hold.
-
The bearish swing can complete a wave 5 (green) of wave C (yellow) of a wave W (pink) of wave 2 (grey).
A strong bearish drop for natural gas is nearing support at $5
NGAS is quickly dropping lower as we expected last week:
-
The bearish decline has been marked as a wave 3 (green).
-
However, price action can stop at the support zone (blue) and make a bounce.
-
A mild bullish correction marks the end of wave 3 (green) and the start of wave 4 (green).
-
A bearish breakout (orange arrow) below the corrective pattern indicates a downtrend towards the next Fibonacci target.
-
This can complete wave 5 (green) of wave 5 (yellow) of wave 3 (pink) of A (grey).
-
A deeper bullish retracement above $6.4 puts this bearish Elliott Wave analysis on hold.
The analysis is done with the indicators and template from the SWAT method simple wave analysis and trading. For more daily technical and wave analysis and updates, sign up to our newsletter

 vs. The Sandbox (SAND) vs. The Hideaways (HDWY)")