Tron (TRX) Price Strong Amid Crypto Market Fall
TRON (TRX) price has moved above a minor resistance area and is about to increase above a long-term resistance.
Readings in multiple timeframes support the continuation of the upward movement. However, a weekly close above the long-term resistance is necessary to confirm the validity of the breakout.
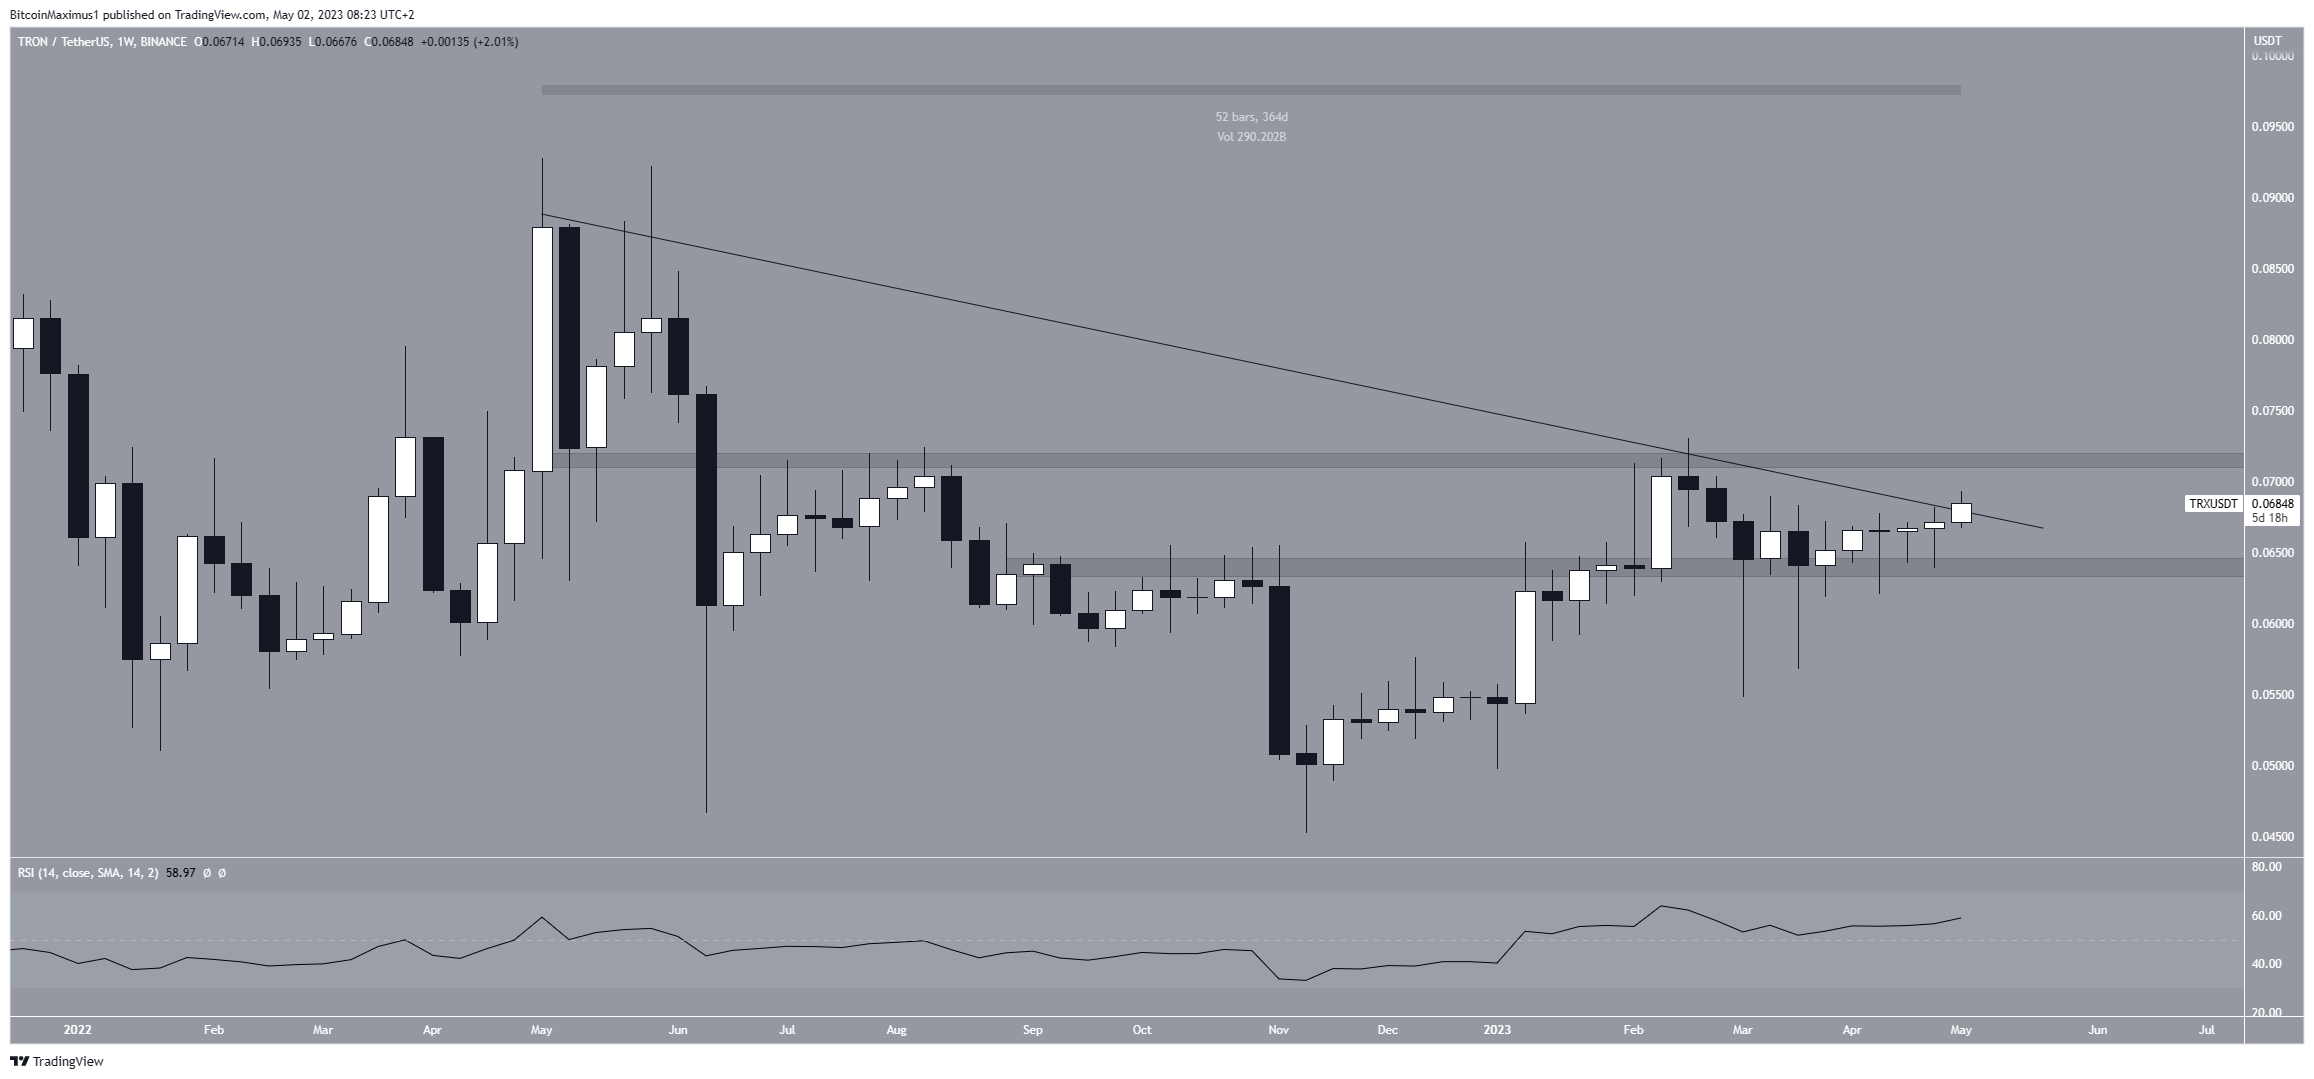
TRON price reaches crucial resistance
TRX price has been increasing since November 2022. In February 2023, it reached a new annual high of $0.073. However, the price has since fallen.
The annual high was combined with a rejection from a descending resistance line that has been in place for 364 days. When the price follows such a long-term resistance line, the trend is considered bearish as long as the price does not break out of the line.
Currently, the TRX price is trading slightly above the resistance line, but has not reached a weekly close above it. The weekly relative strength index (RSI) supports the continuation of the increase since it is above 50 and moving upwards.
Market traders use the RSI as a momentum indicator to identify overbought or oversold conditions and to decide whether to accumulate or sell an asset.
Readings above 50 and an upward trend indicate that bulls still have an advantage, while readings below 50 indicate the opposite. The nearest resistance area is at $0.072, while the nearest support area is at $0.064.
TRX Price Prediction: Will Bulls Succeed in Breakout Attempt?
The technical analysis from the daily timeframe provides a bullish TRX price prediction. Both the RSI and the price action support this possibility.
First, TRX price has moved above the minor horizontal resistance area at $0.067. When combined with the short-term ascending support line, this creates an ascending triangle.
The ascending triangle is considered a bullish pattern, which bodes well for the future price and leads to breakouts most of the time. A breakout that raises the full height of the pattern will take TRX to $0.082.
Like the weekly, the daily RSI is above 50 and rising. Therefore, it supports the ongoing upward movement.
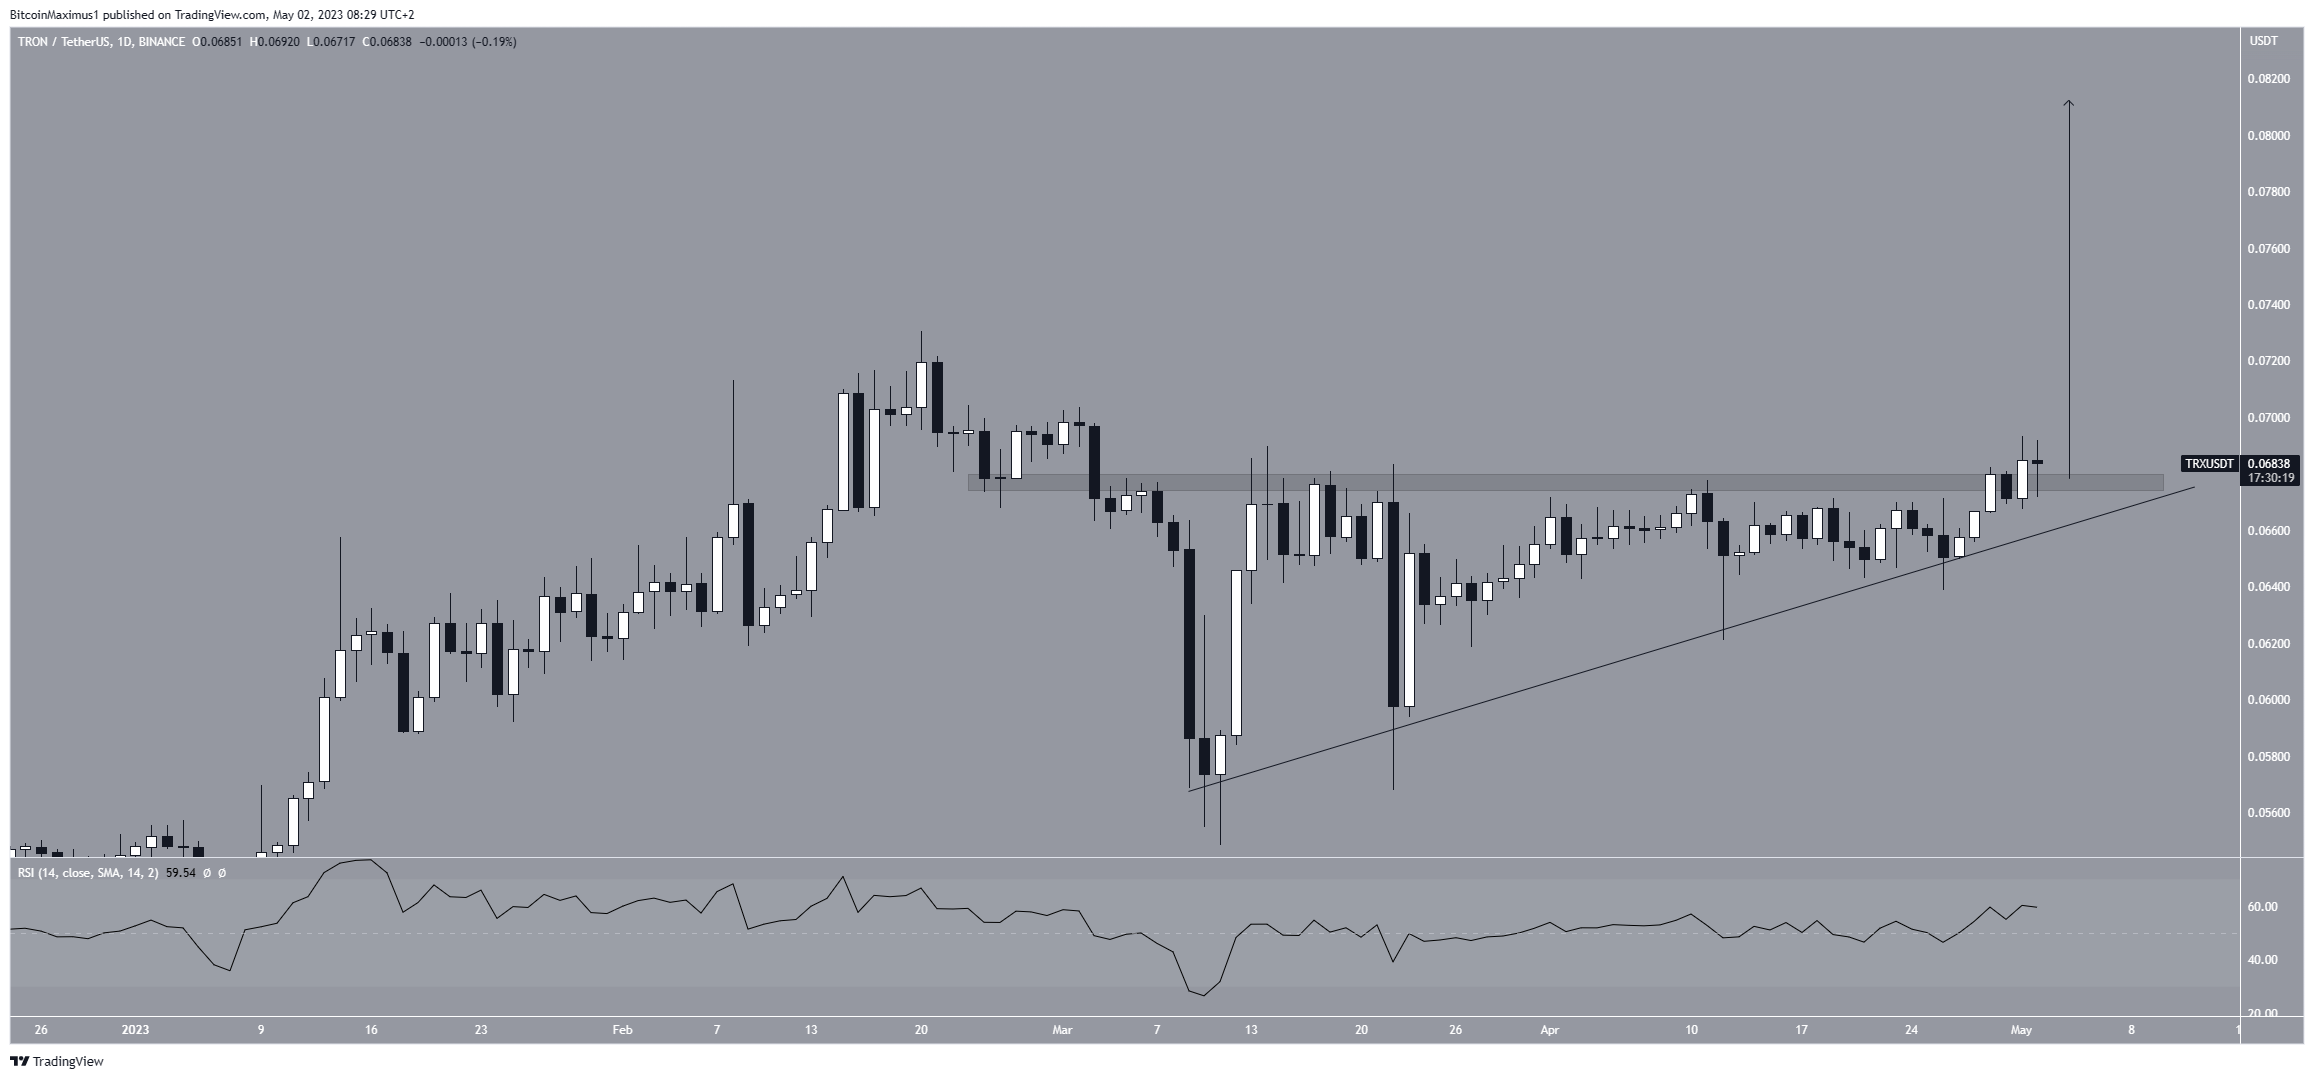
Despite these bullish signs, a close below the rising support line will invalidate this bullish TRON price forecast. This would mean that the breakout was invalid and a drop to at least $0.064 would follow.
For BeInCrypto’s latest crypto market analysis, click here.
Disclaimer
In line with Trust Project guidelines, this price analysis article is intended for informational purposes only and should not be considered financial or investment advice. BeInCrypto is committed to accurate, objective reporting, but market conditions are subject to change without notice. Always do your own research and consult with a professional before making any financial decisions.


