Top 3 Price Prediction Bitcoin, Ethereum, Ripple: The Interminable Bottom
- The latest decline in Bitcoin price wipes out all bullish liquidity since July while printing a bullish candle on larger timeframes.
- Ethereum falls into a key Fibonacci level as the price decline continues under low volume.
- Ripple has rallied 20% amid turbulent conditions, the technicals suggest a dual scenario underway.
The cryptocurrency market has wiped out a majority of the liquidity established over the summer. Nevertheless, the sale leaves traces of optimism despite the loss of market value.
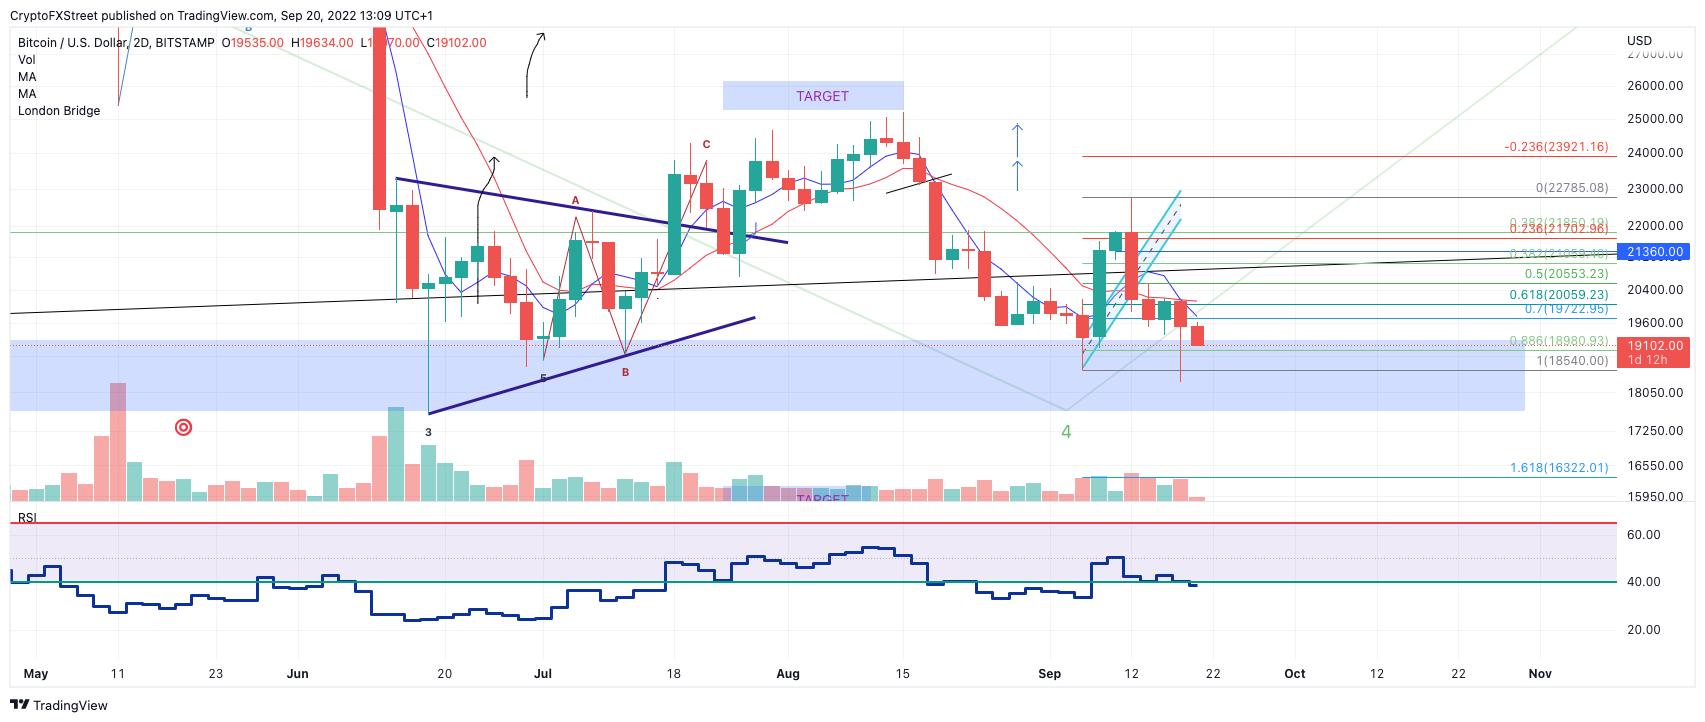
Bitcoin price is showing mixed signals
Bitcoin price has investors on edge as the digital peer-to-peer currency has fallen below $20,000. The recent breach established a new September low of $18,271 and erased all previous swing lows dating back to July 2022.
Bitcoin price is currently auctioning at $19,224. The bulls were able to print a hammer candle on the 2-day chart, which is an optimistic gesture during the downtrend. A Fibonacci retracement tool around the previous 20% uptrend in September shows the hammer closing below the 61.8% retracement level.
BTC USDT 2-Day Chart
Closing below the key Fib level can be a warning to bullish traders not to get too ambitious in aiming for higher targets. The volume profile indicator reinforces the need for caution as the hammer candle shows low volume compared to the previous June 18 candle, which induced a 40% summer rally. Hammers should generally also be followed by a green light with a positive finish for confirmation, which does not appear to be the case at the time of writing.
In the short term, BTC may redirect northward to $21,200 and $21,600 based on the price projections of the last 2-day candle. A break above the 61.8% Fib level of $20,059 could be a signal for a sideways trader to enter the market. A stop loss could be placed below the new low of $18,271, although the safest invalidation would be the June 18 swing at $17,592.
In the following video, our analysts dive deep into the price action of Bitcoin, analyzing key levels of interest in the market. -FXStreet Team
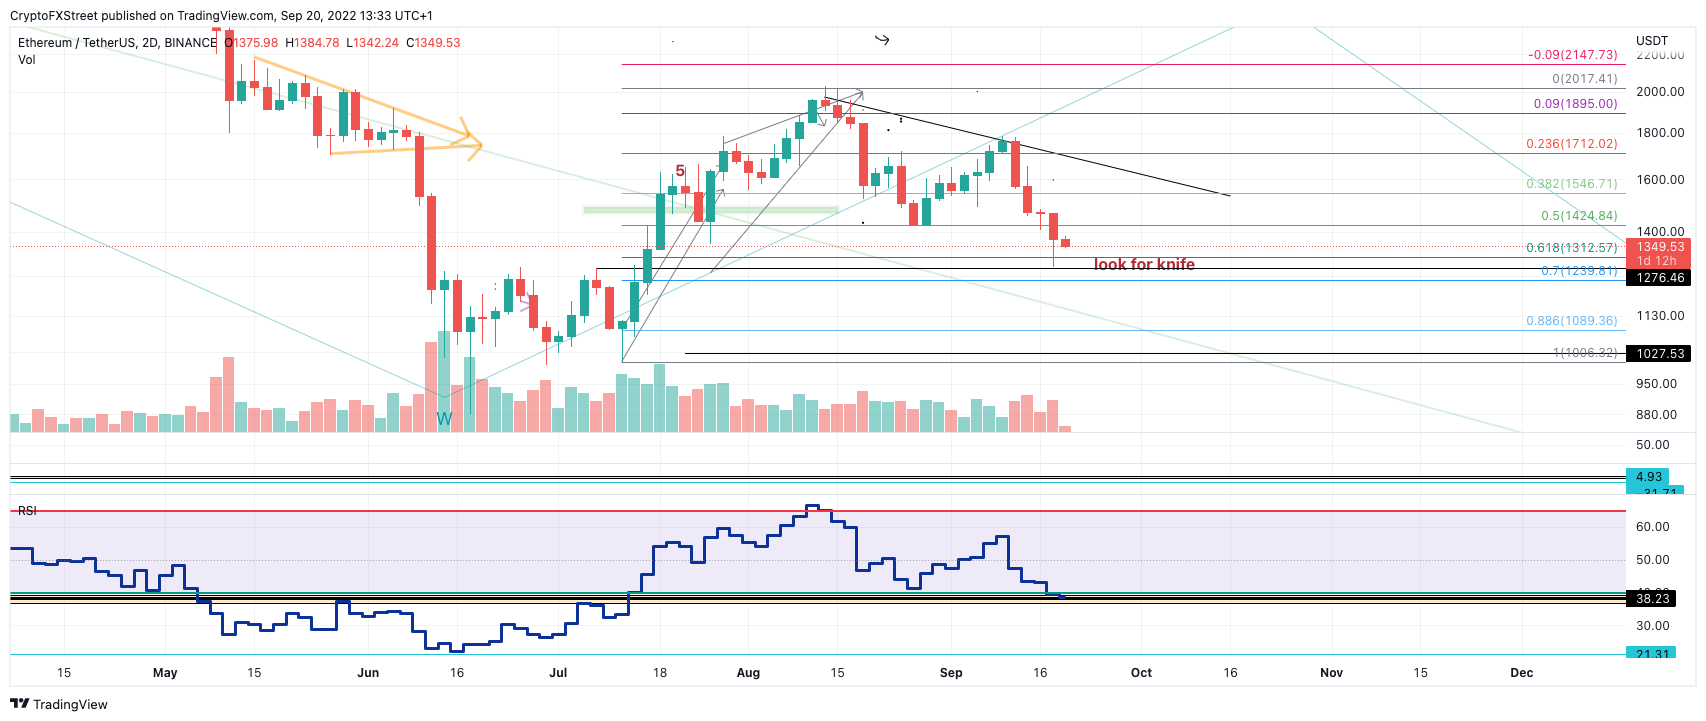
The Ethereum price is at a critical level.
The Ethereum price entices investors on the sidelines to start entering the market. On September 19, the bears successfully broke the previous August low and the June 26 low of $1,352. The bears made a new September low of $1,280. Shortly after the liquidity hunt, the bulls retook half of the decline, leaving investors confused about what can happen next,
The Ethereum price is currently auctioning at $1,349, A Fibonacci Retracement indicator surrounding the major uptick in the client’s summer rally shows the recent selloff as just a 61.8% retracement. The Relative Strength Index hovers in the ideal territory for a market bottom. Still, it has a few ticks left to fall based on previous lows throughout Ethereum’s trading history. The volume profile indicator remains relatively low amid the selloff, adding further weight to the idea that the downtrend is a correction that will eventually reverse.
ETH USDT 2-Day Chart
Still, the Ethereum price has room to fall. The surest invalidation of the uptrend thesis at the moment is a break below the June 12 swing at $1006. This provides enough wiggle room for investors to avoid last-minute liquidity scrambles before the next expected Ethereum bull run takes place.
In the following video, our analysts dive deep into the price action of Ethereum, analyzing key levels of interest in the market. -FXStreet Team
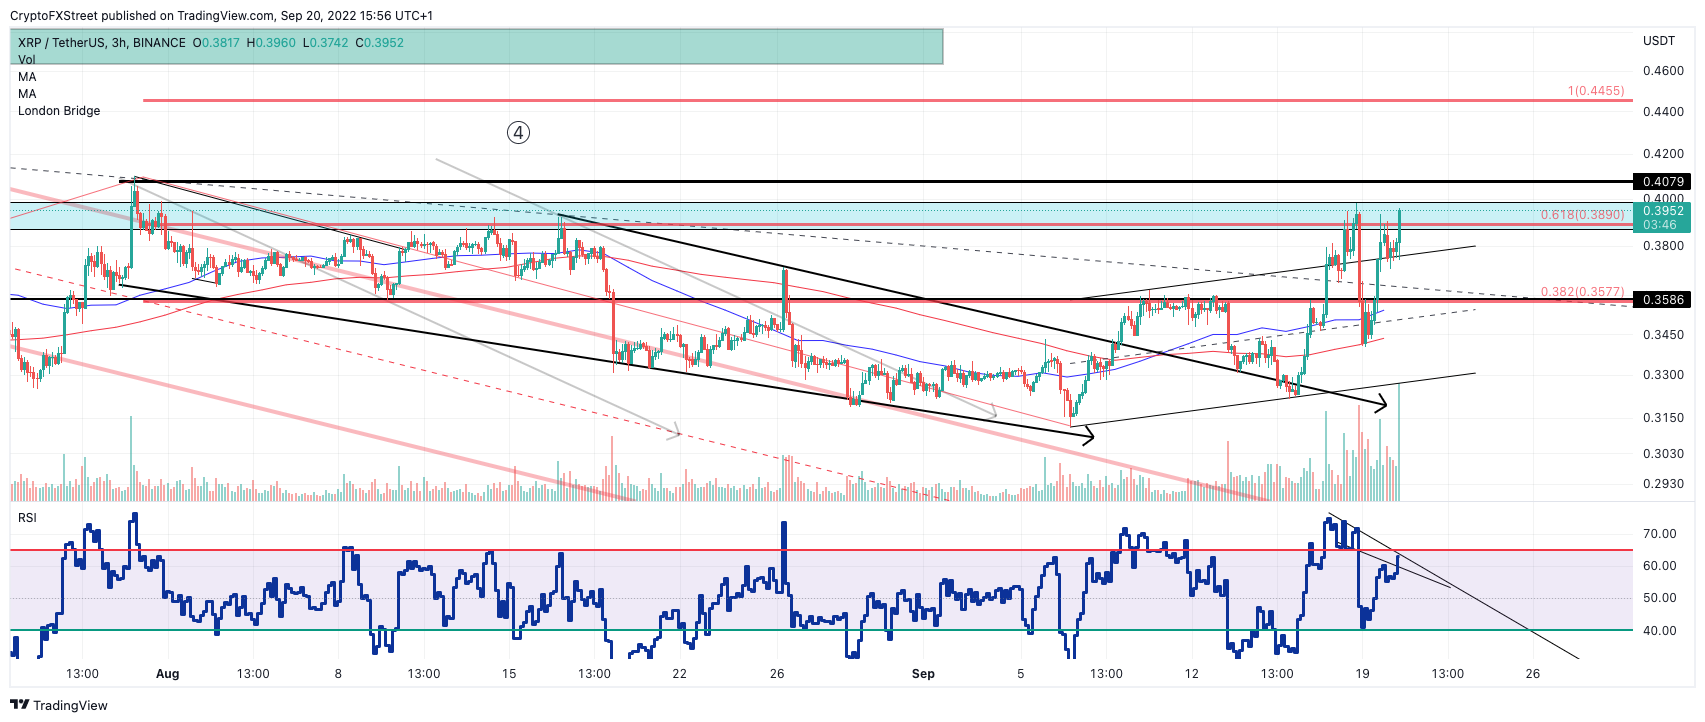
XRP price shows a dual scenario
Ripple’s XRP price is on the brink of glory or destruction. The digital remittance token has rallied 20% since its previous decline during the September 12 CPI release. Nevertheless, the uptrend has not been easy as it has produced strong pullbacks with large volume inflows along the way.
The XRP price is currently hovering above a broken parallel channel around the first impulsive rally in September. The gesture is very wave-3-like, which could lead to a strong move towards $0.45 if $0.41 were to be touched. Still, the current price action is at an early stage, which carries a serious risk if it’s wrong.\
XRP USDT 2-Day Chart
The bearish scenario suggests that the current uptrend is an ABC correction of a previous leading diagonal. Thus, the $0.041 origin point of the diagonal is the line in the sand to invalidate the bearish scenario.
A buy stop can be placed at $0.41. If the bulls break this level, an impulsive rally should occur, with the first target at $0.45. Such a move would result in a 20% increase from the current XRP price.
In the following video, our analysts dive deep into the price action of Ripple, analyzing key levels of interest in the market. -FXStreet Team

