Top 3 Price Prediction Bitcoin, Ethereum, Ripple: Crypto Season Meets Resistance
- Bitcoin prints a higher low but faces resistance at $17,000.
- Ethereum remains submerged below a broken support level.
- XRP price has recovered 20% of market losses but may lose momentum.
The crypto market is trying to retaliate against the recent attack experienced earlier this month. As an congestion zone forms on BTC near the psychological $17,000 level, the top three cryptos remain indecisive. Key levels are defined to predict possible outcomes for the crypto giants in the coming weeks.
Bitcoin price faces resistance
The Bitcoin price is the main focus for crypto traders heading into the third trading week of November, as its next move is likely to determine the outcome for the rest of the market. After a 10% decline over the weekend, the bulls finally moved close to the upper $15,000 level to provide support. The peer-to-peer digital currency managed to recover 8% of its market value. Still, despite the hopeful gesture, Bitcoin will need to take on a lot more work to truly define a strong countertrend rally.
Bitcoin price is currently trading at $16,996. The 10% decline made a higher low of $15,815. The Relative Strength Index (RSI) shows the market cooling as the indicator has climbed back to support on smaller time frames. Still, the peer-to-peer digital currency faces significant bearish pressure as the 200-week moving average, 21-day simple moving average and 8-day exponential moving average hover above the current auction price.
If market conditions persist, Bitcoin could be headed for a low near $15,000. Invalidating the bearish idea is a break above the $18,531 thrust candle. If the level is marked, the bulls could produce a countertrend rally back to $20,000. Bitcoin price will rise by 20% if the invalidation scenario occurs.

BTCUSDT 12 Hour Chart
In the following video, our analysts dive deep into the price action of Bitcoin, analyzing key levels of interest in the market. -FXStreet Team
Ethereum price has been lowered
Ethereum price is facing significant bearish pressure entering the third trading week of November. After a 35% decline on the month, the bulls produced a retaliatory rally that was capped near the recently broken support at $1,300. After a few days of consolidation, the ETH price is still lowered below the barrier and is showing signs that bulls are hesitant to stay in the market.
Ethereum price auctions at $1,264 as bulls attempt to thwart 8-day exponential moving average. A rejection from the indicator would be explosive and could provoke a retest of the $1,080 low. The Relative Strength Index broke oversold levels during the previous decline, suggesting that the downtrend is still ongoing.
Invalidation of the bearish thesis could occur if the bulls prevent the $1350 swing high. By doing so, an additional rally towards the 21-day simple moving average of $1450 will have a good chance of occurring. Such a move would result in an increase of 17% from the current Ethereum price.
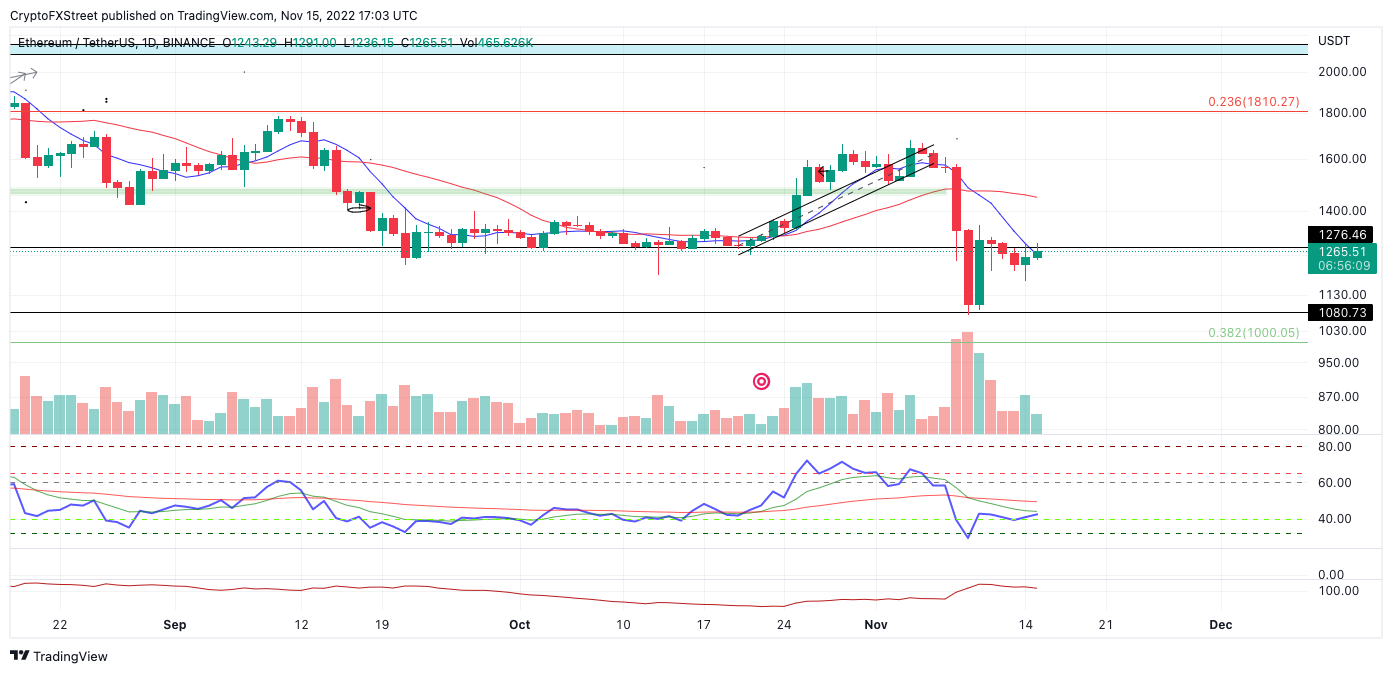
ETHUSDT 1-Day Chart
In the following video, our analysts dive deep into the price action of Ethereum, analyzing key market interest levels. -FXStreet Team
XRP price bounces back
The XRP price is currently auctioning at $0.39 as the bulls have staged another recovery rally to recoup 20% losses from the previous week. Now, as the price consolidates just below the $0.40 barrier, traders are forced to ask a key question: is the countertrend rally about to end or is it just getting started?
The XRP price has landed above the 8-day exponential moving average, which separates it from Bitcoin and Ethereum. The volume profile indicator also shows the bulls trying to produce a ramp pattern, but the number of transactions is still relatively lower than the previous declines. With this in mind, the XRP price may need to remain in the range between $0.39 and $0.31 for a few more days before the next definitive trend can be established.
For bears looking to enter the market, invalidation of the bearish scenario could occur if the bulls obstruct the $0.46 barrier. By doing so, an additional rally towards the monthly high near $0.51 could occur. XRP would rise by 30% if said price action were to happen.
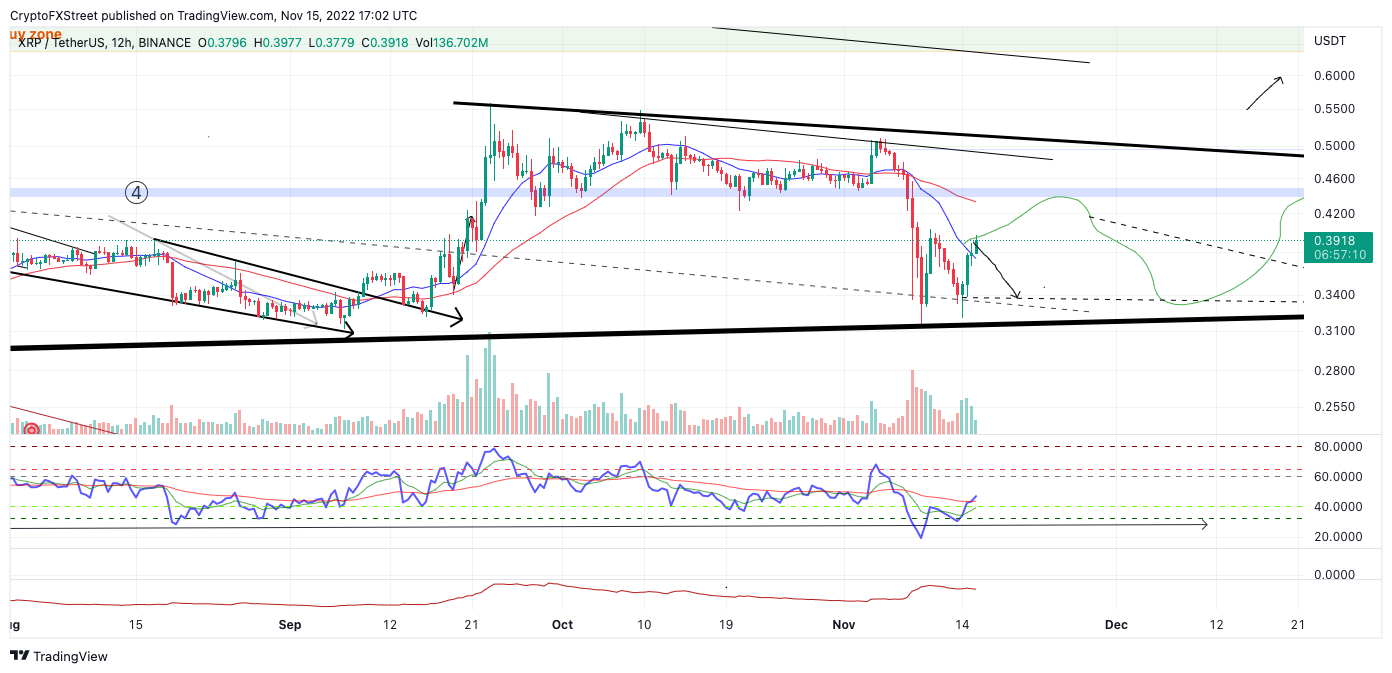
XRPUSDT 12 Hour Chart
In the following video, our analysts dive deep into the price action of Ripple, analyzing key levels of interest in the market. -FXStreet Team


